
Vea también


 07.09.2026 09:31 AM
After Friday's plunge toward the $79,000 area, Bitcoin remained trading around that level. However, US spot Bitcoin ETFs recorded only $174.6 million in net inflows on Friday, September 4. That's a sharp slowdown compared with Thursday, September 3, when inflows were $730.8 million. The 76.1% decline also shows that the number of funds with positive inflows dropped from seven to just two. That concentration deserves particular attention, because the last trading session was effectively supported by two institutions rather than a broad front of buyers.
The positive inflows were driven exclusively by BlackRock's IBIT (+$117.4M) and Fidelity's FBTC (+$57.2M), whereas on Thursday ARKB, BITB, MSBT, GBTC, and BTC also finished in the green. This primarily benefits the two largest market players, whose dominant positions only strengthen when overall interest wanes, while it hurts smaller issuers. It implies that institutional demand is concentrating around the most liquid and recognizable brands even amid a general slowdown, rather than being spread evenly across the full lineup of a dozen competing funds. It's important to emphasize that the remaining ten products — including BITB, ARKB, BTCO, EZBC, BRRR, HODL, BTCW, MSBT, GBTC, and BTC — showed zero net inflows, not outflows.
Should this slowdown be viewed as a worrying signal? I don't think so, because the absence of outflows even amid a sharp drop in interest suggests investors who are holding positions are not rushing to take profits after a strong 30-day rise in the asset.
In my view, the slowdown in inflows is more a reaction to the data than a trend reversal, and I expect broader fund participation to recover already early this week as market trading activity returns to normal volumes.
Trading recommendations
Bitcoin
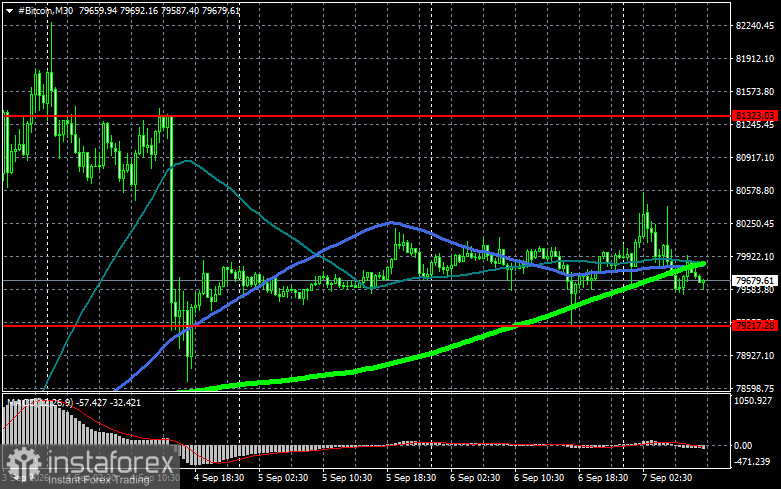
Buyers are currently targeting a return to $81,300, which would open a direct path to $83,600 and then on to $85,600; surpassing $85,600 would signal attempts to resume a bull market. On the downside, I expect buyers at $79,200. A return of the price below that area could quickly push BTC toward $77,200. The furthest target on the downside is around $75,300.
Ethereum
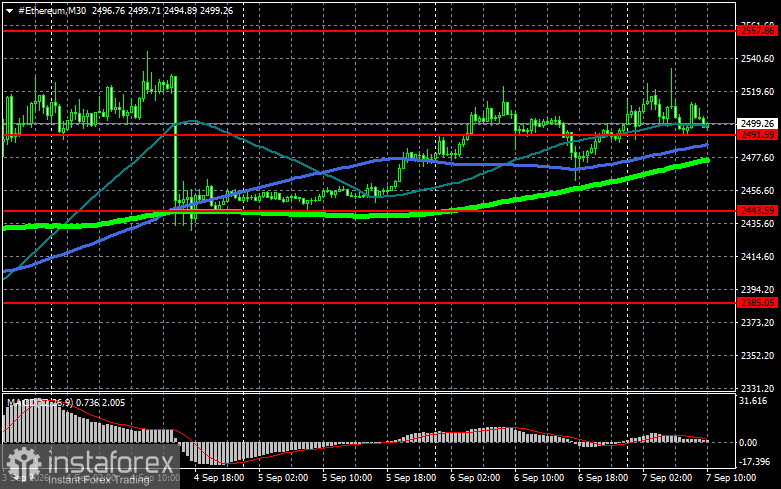
A clear hold above $2,557 opens a direct path to $2,624. The furthest upside target is the high around $2,684; breaking above that would indicate strengthening bullish sentiment and renewed buyer interest. On the downside, I expect buyers at $2,491. A drop back below that area could quickly push ETH toward $2,443. The furthest downside target is around $2,385.
What's on the chart
Price testing or crossing any of these moving averages often either halts movement or injects fresh momentum into the market.


