Veja também

 30.04.2026 04:10 AM
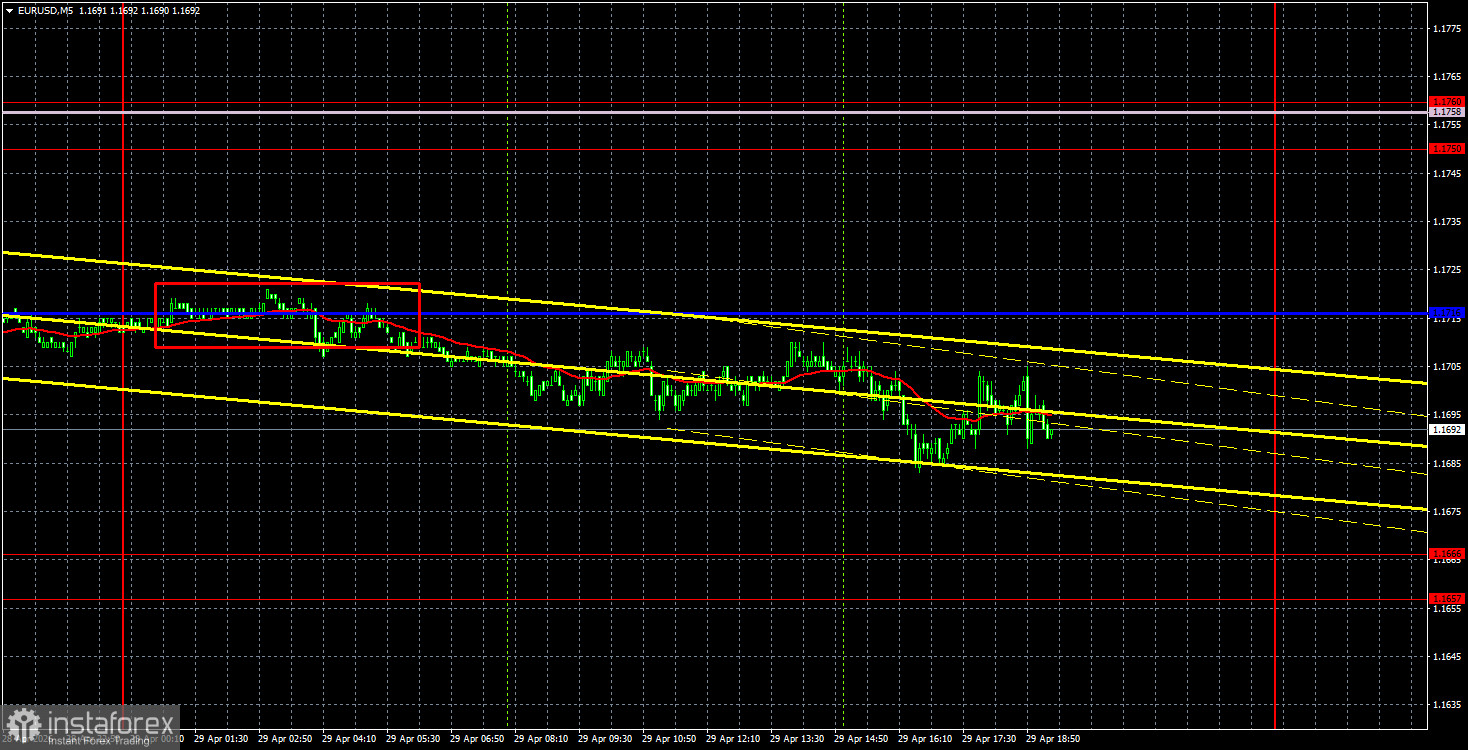
The EUR/USD currency pair once again traded rather weakly on Wednesday, with low volatility throughout most of the day. In the late evening, the FOMC meeting and Jerome Powell's speech took place, which, of course, increased market volatility during those final hours. However, during the remaining time, there were no market movements. Even relatively important reports on inflation in Germany and durable goods orders in the U.S. were ignored by the market. Thus, the euro remains within a new downward trend that formed after breaching the Ichimoku indicator lines and the trend line.
From a technical perspective, the upward trend has been broken, but further dollar growth requires a reason. The geopolitical factor no longer provides the same support for the U.S. currency; the market is ignoring the macroeconomic backdrop; fundamental events are not occurring as frequently; and the long-term trend remains upward. Hence, we believe the probability of a new rise in the pair is higher than the probability of a continuation of the decline. However, to be confident in this development, a breakthrough of the Ichimoku indicator lines is necessary.
In the 5-minute timeframe on Wednesday, only one sell signal was generated. During the Asian trading session, the pair rebounded from the Kijun-sen line and moved down about 20 pips, even less than the day before. Volatility was once again low, and the nearest target area was not reached.
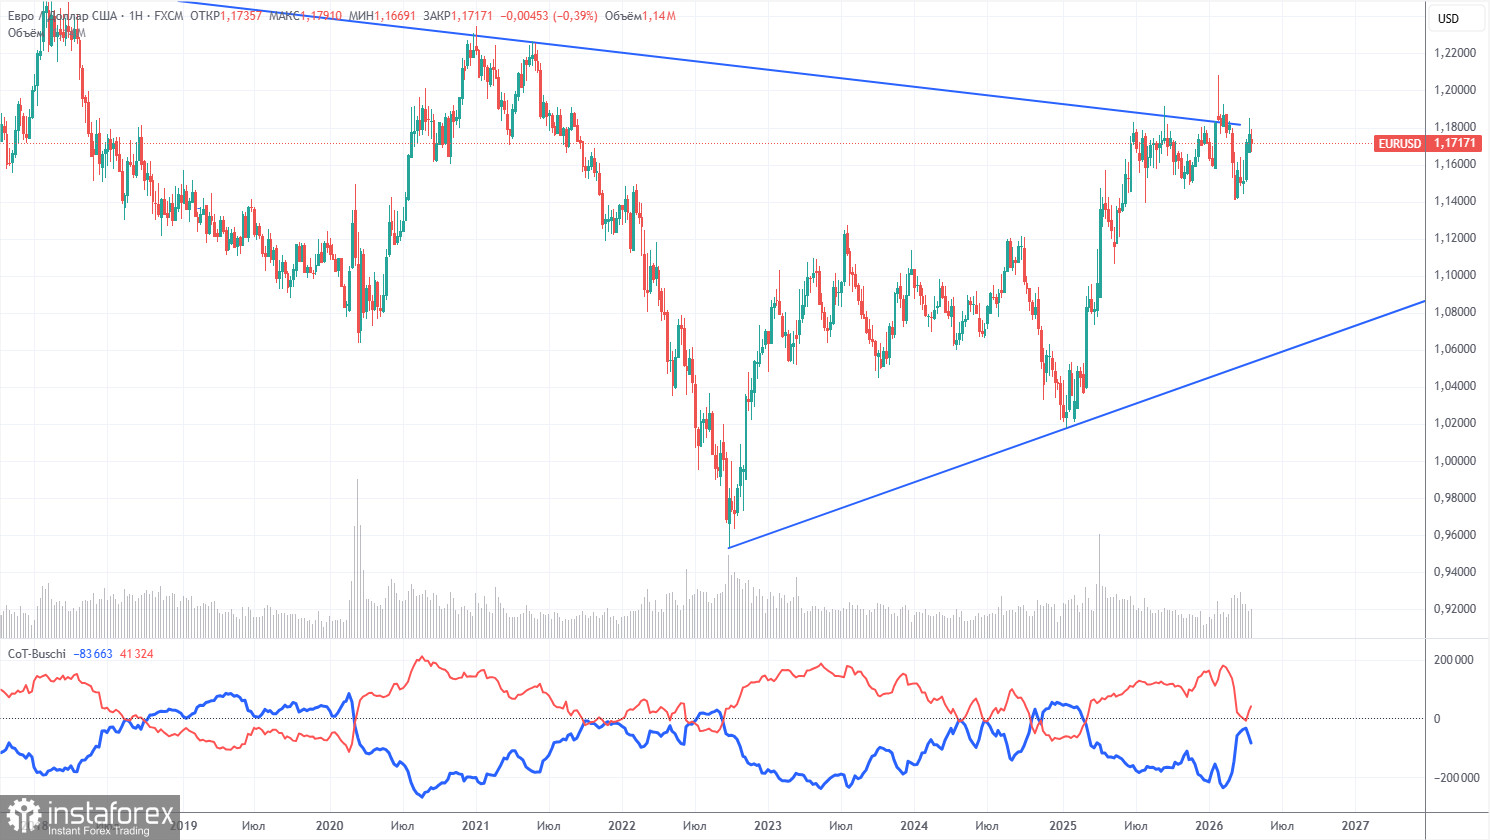
The latest COT report is dated April 21. The illustration on the weekly timeframe clearly shows that the net position of non-commercial traders remains "bullish," but is rapidly declining due to geopolitical events. Traders have been offloading the euro in recent months in favor of the U.S. dollar. Donald Trump's policy has not changed, but the dollar has acted as a "reserve currency" for some time. However, this process may already be behind us.
We still do not see any fundamental factors that would strengthen the euro, while sufficient factors remain for the dollar to decline. The war in the Middle East made the dollar temporarily super-attractive, but when the "shelf life" of this factor expires, everything will revert to the way it was. This period may have already passed. In the long term, the euro might fall to the level of $1.06 (the trend line), but the upward trend will still remain relevant. Currently, the pair has not strayed significantly from the descending trend line, which has been breached several times.
The positioning of the red and blue lines of the indicator indicates parity between bulls and bears. Over the last reporting week, the number of long positions for the "Non-commercial" group increased by 2,700, while the number of shorts decreased by 12,500. Consequently, the net position increased by 15,200 contracts over the week.
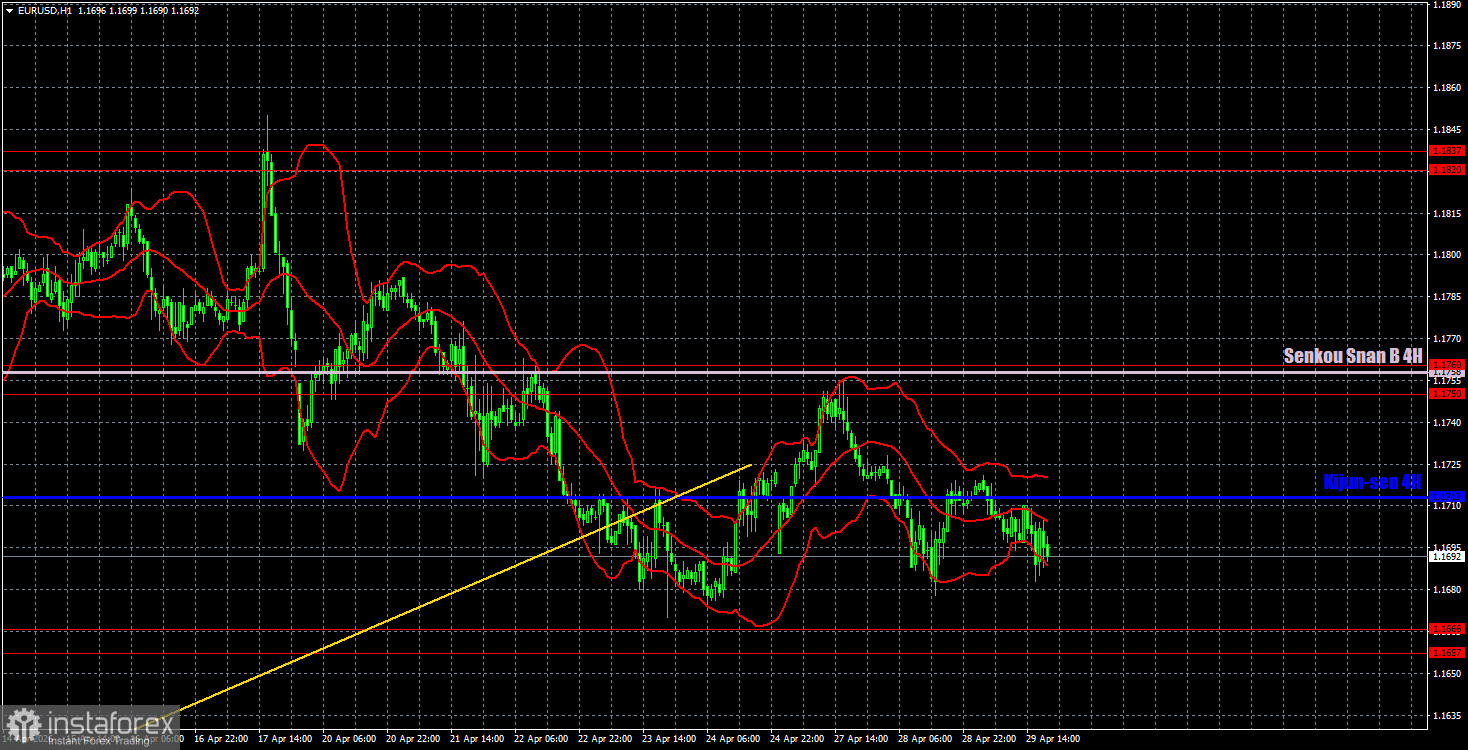
On the hourly timeframe, the EUR/USD pair has begun to form a downward trend. The situation in the Middle East remains tense, but it is not worsening, so there are currently few strong reasons for the U.S. dollar to strengthen further. There will be enough important events this week, so good volatility can be expected. Technically, the dollar is in a more favorable position than the euro, but this advantage still needs to be utilized.
For April 30, we highlight the following levels for trading: 1.1362, 1.1426, 1.1542, 1.1615-1.1625, 1.1657-1.1666, 1.1750-1.1760, 1.1830-1.1837, 1.1907-1.1922, as well as the Senkou Span B line (1.1758) and Kijun-sen (1.1713). The Ichimoku indicator lines may shift throughout the day, which should be taken into account when determining trading signals. Do not forget to set a stop-loss order to breakeven if the price moves in the correct direction by 15 pips. This will protect against potential losses if the signal turns out to be false.
On Thursday, a considerable number of macroeconomic reports are scheduled in Germany, the EU, and the U.S. Most will likely be ignored by the market, but we still advise paying attention to the EU inflation report and the U.S. GDP report. The European Central Bank meeting will also take place today, but no important decisions are expected. Volatility may be elevated, but not as high as everyone is anticipating.
Today, traders may open short positions if the price bounces off the Kijun-sen line or the 1.1750-1.1760 area, targeting the 1.1657-1.1666 area. Long positions remain relevant, with a target of 1.3588, as the price bounced from the 1.3465-1.3480 area.
Price levels of support and resistance – thick red lines, around which the movement may end. They are not sources of trading signals.
Kijun-sen and Senkou Span B lines – lines of the Ichimoku indicator that are carried over to the hourly timeframe from the 4-hour one. They are strong lines.
Extreme levels – thin red lines from which the price has previously bounced. They are sources of trading signals.
Yellow lines – trend lines, trend channels, and any other technical patterns.
Indicator 1 on COT charts – the size of the net position of each category of traders.


