Veja também

 11.12.2025 06:49 AM
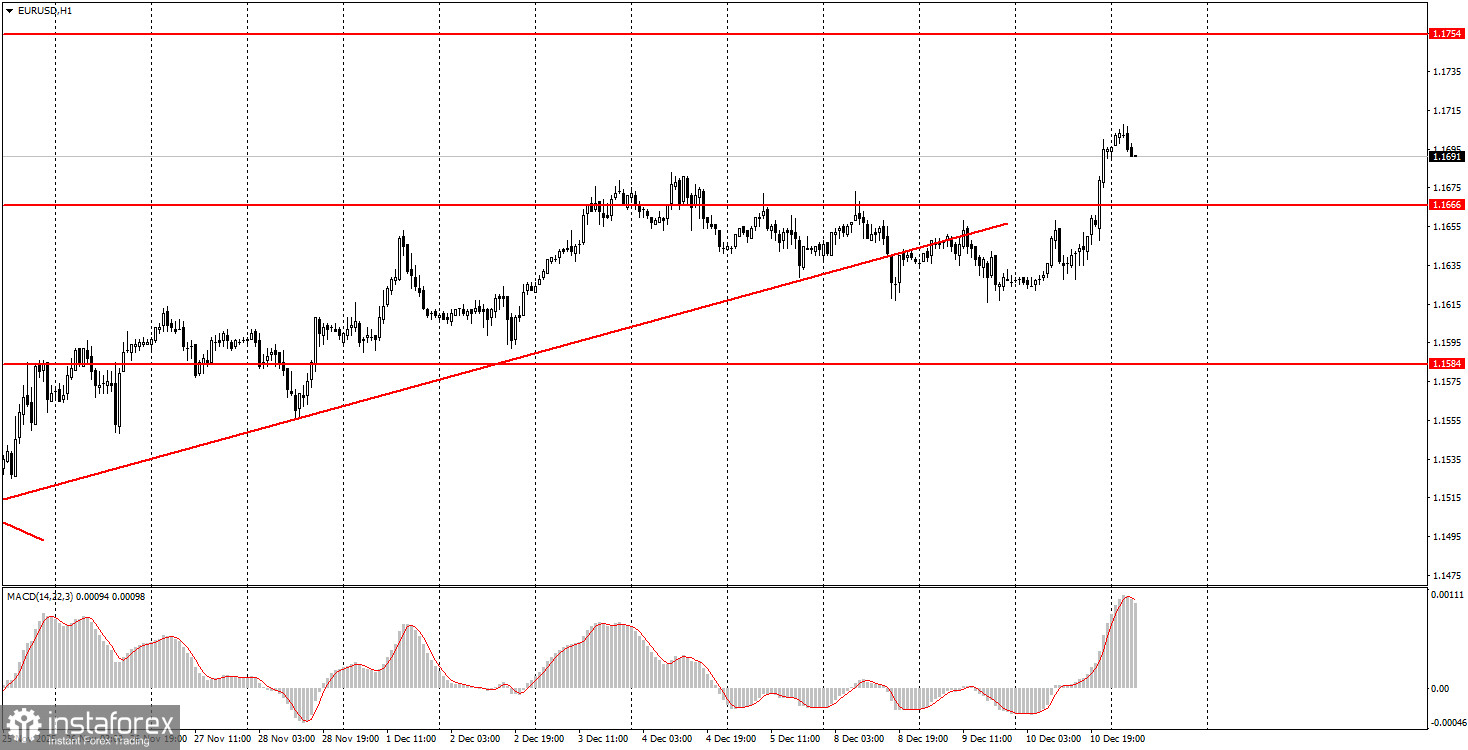
The EUR/USD currency pair moved exactly as most traders expected on Wednesday. It is worth noting that the market does not always react clearly or logically to the FOMC meeting results. Yesterday indeed could have been such a case, as in recent months the dollar has responded to the Federal Reserve's monetary easing with growth. However, this time the dollar fell despite the Fed's promise to pause rate cuts in 2026. Overall, as most experts had anticipated, the key rate was lowered for the third consecutive time, but it was done in advance. There is still no macroeconomic data on the labor market, unemployment, or inflation, so the Fed cannot make a well-informed decision that reflects the current state of the US labor market. As a result, a "pre-emptive" decision was made. Since this decision is "dovish" in any case, the dollar reasonably fell. We have been predicting the rise of the pair for two weeks based solely on the technical reversal at the lower boundary of the sideways channel at 1.1400-1.1830 on the daily timeframe.
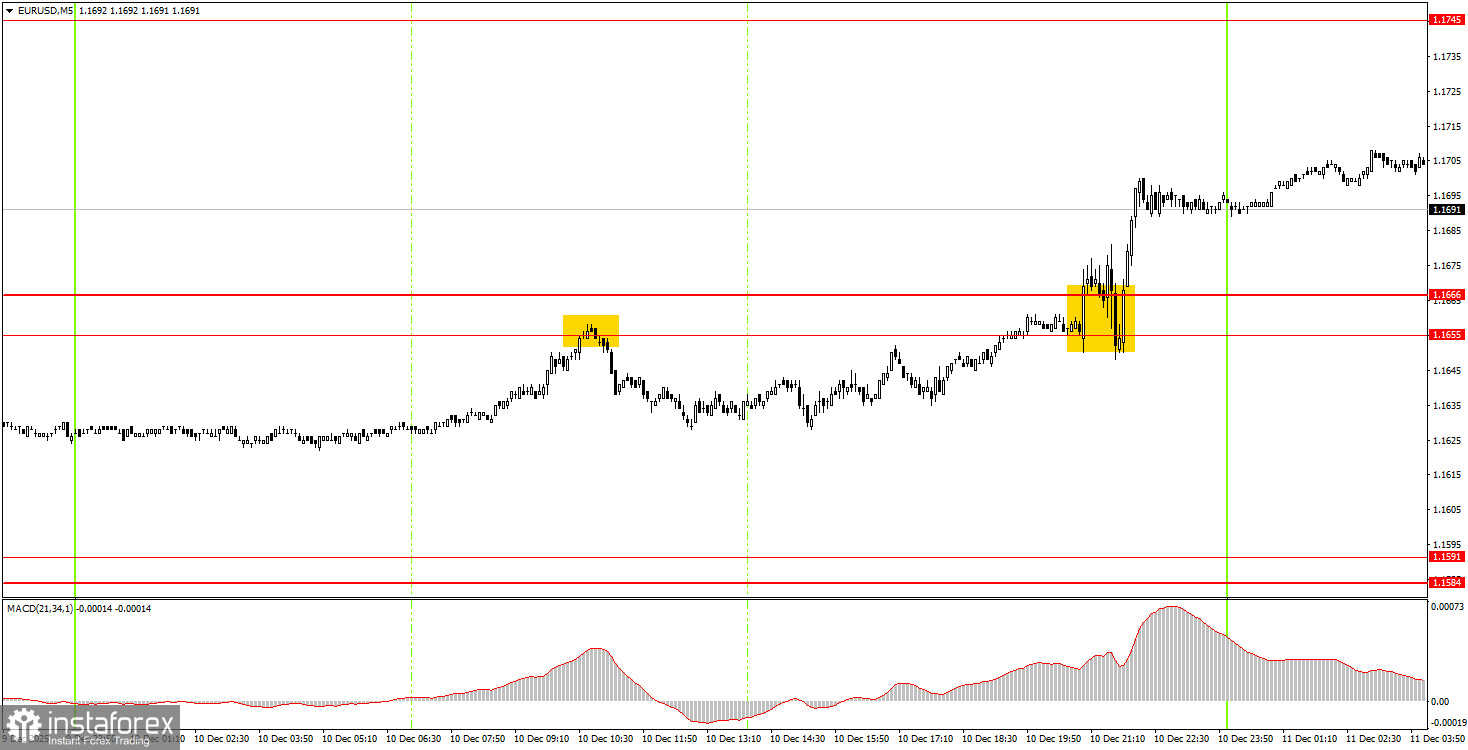
On the 5-minute timeframe, several trading signals were formed yesterday. The first was generated during the European trading session, when the price bounced off the 1.1655 level. The pair moved down by 15 pips, so there were no losses on this trade, and it could have been closed manually for a small profit before the FOMC meeting. After the FOMC meeting, selling the dollar became advisable, and simultaneously, a buy signal was formed in the area of 1.1655-1.1666. Thus, novice traders could open long positions, which are currently in profit.
On the hourly timeframe, the EUR/USD pair continues to form an upward trend, even though the price has breached the trend line. The general fundamental and macroeconomic backdrop remains very weak for the US dollar, so we expect further growth. Even technical factors currently support the euro, as the sideways movement on the daily timeframe persists, and after a reversal near the lower boundary, it is reasonable to expect growth towards the upper boundary.
On Thursday, novice traders can again trade from the area of 1.1655-1.1666, as the price has hovered around this level for six consecutive days. A price bounce from this area will allow for long positions targeting 1.1745-1.1754. A settlement below it would indicate short positions targeting 1.1584-1.1591.
On the 5-minute timeframe, levels to consider include 1.1354-1.1363, 1.1413, 1.1455-1.1474, 1.1527-1.1531, 1.1550, 1.1584-1.1591, 1.1655-1.1666, 1.1745-1.1754, 1.1808, 1.1851, 1.1908, and 1.1970-1.1988. There are no significant events or reports scheduled in the Eurozone or the US on Thursday. Therefore, volatility may once again drop to minimal levels, and trading will have to rely on "bare" technical analysis.
Important Note: Significant speeches and reports (always included in the news calendar) can greatly influence the movement of the currency pair. Therefore, during their release, it is advisable to trade cautiously or exit the market to avoid sharp reversals against the preceding movement.
Remember: For beginners trading in the Forex market, it is important to understand that not every trade can be profitable. Developing a clear strategy and practicing money management are keys to long-term trading success.


