
Lihat juga


 28.09.2026 02:52 PM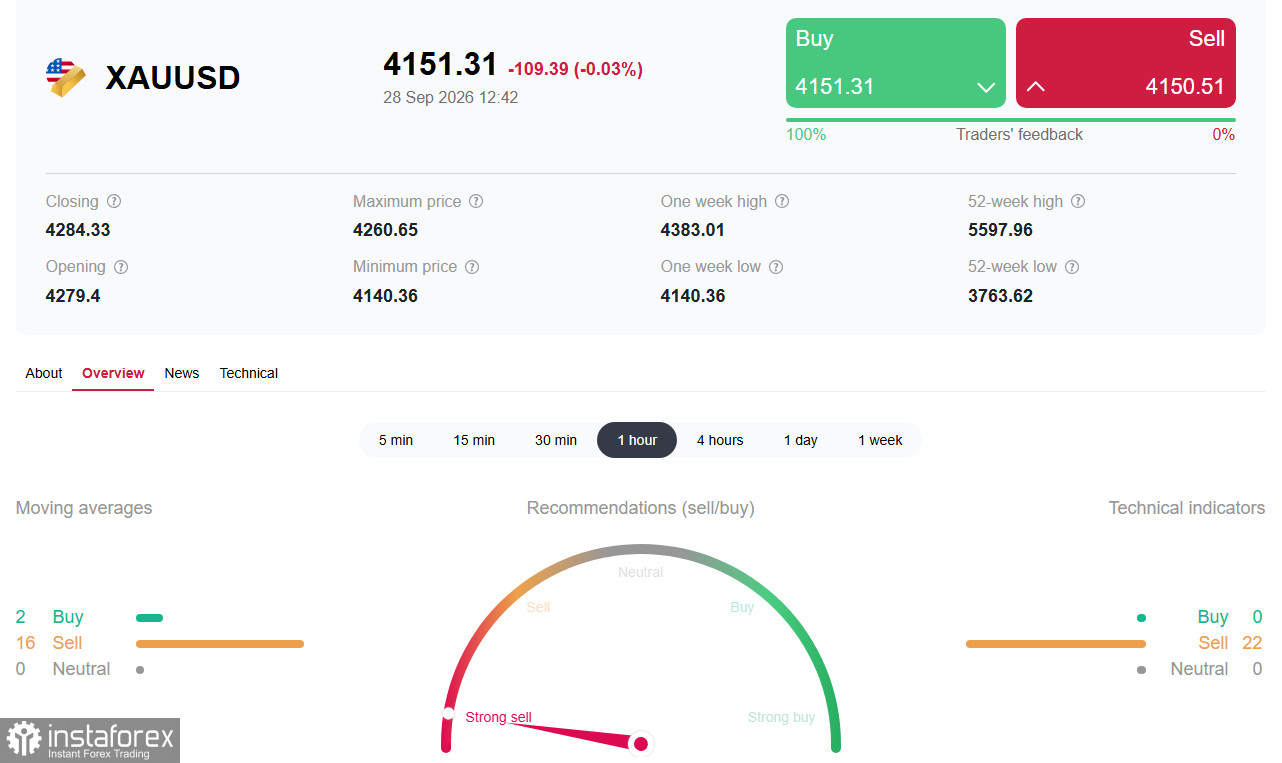
See also: InstaTrade trading indicators for XAU/USDv
Gold continued to fall on Monday, hitting a low not seen since August 5 and trading around $4,150 an ounce in the US session. The daily decline exceeded 3%, and from the January record near $5,600 the metal has fallen roughly 25%. The principal pressure comes from several factors: rising oil prices increase inflation risks and support expectations of further Fed tightening, while Treasury yields are making multi-year highs.
Key drivers
Oil remains the primary catalyst for inflation fears. Over the weekend US President Donald Trump rejected an Iranian proposal to reopen the Strait of Hormuz within seven days, saying Tehran "overestimated its capacity." Iran replied it will not soften conditions for resuming shipping, including sanctions relief, access to frozen assets and an end to US blockades. Brent has risen roughly 70% year-to-date, and WTI added nearly 3.5% on Monday, approaching $85 per barrel. Persistently high energy prices feed inflation expectations and keep the Fed hawkish.
The market is nearly certain of an October hike. According to CME FedWatch, the probability of a Fed rate increase in October rose to 68–70% from 57.6% a week earlier and just 17.7% a month ago. After the September hike to 3.75%–4.00%, Fed officials continue to send hawkish signals. New York Fed President John Williams said another hike before year-end "seems warranted," and Cleveland Fed President Beth Hammack warned of the risk of high prices becoming entrenched.
Yields at multi-year highs. The 10-year Treasury yield remains above 5.20% — a level not seen since 2007. Societe Generale cites next target levels for 10-year yields at 5.24% and 5.36%; with the trend intact there is little incentive to buy bonds. For gold, which pays no yield, rising yields increase the opportunity cost of holding the metal.
The dollar remains strong, with caveats. USDX traded near 100.90 on Monday, close to two-month highs. Deutsche Bank notes the dollar was the strongest G10 currency last week, benefiting from higher yields and repricing toward a more hawkish Fed. But BBH warns that other central banks' tightening limits policy divergence and USDX may struggle to hold above the June 24 peak at 101.80.
Geopolitics works against gold. Paradoxically, Middle East escalation does not support gold as a safe haven; instead rising oil accentuates inflation fears, strengthens the dollar and raises bond yields, all of which pressure the metal. Trump said he may resume strikes on Iran before the midterms, keeping a geopolitical risk premium in place.
Brief technical analysis
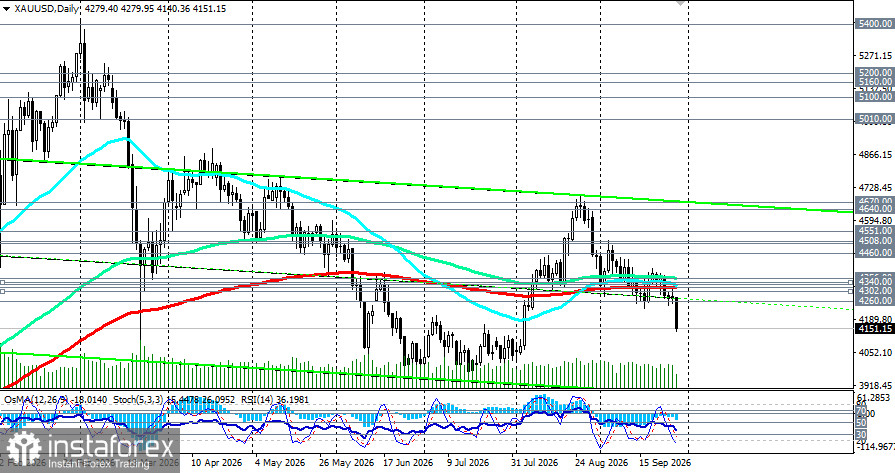
The technical picture is bearish across time frames. Gold trades below key moving averages and indicators show ongoing seller pressure, albeit with signs of oversold conditions.
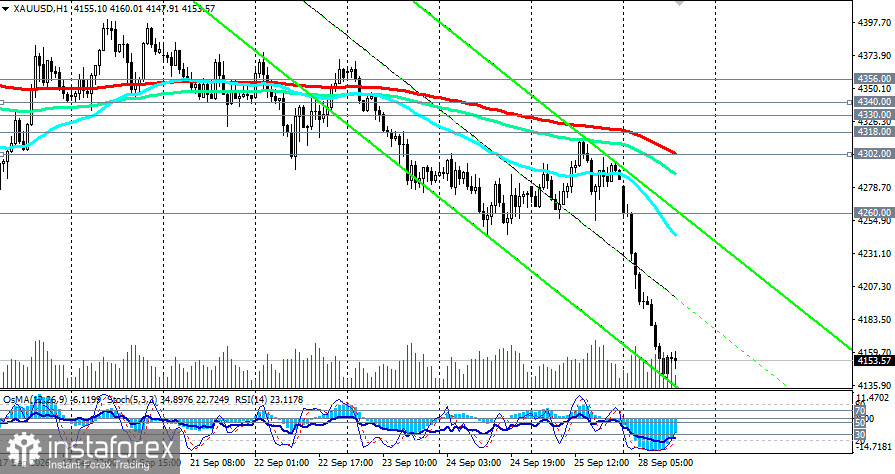
A composite Instaforex technical scan on the hourly chart shows "Strong Sell": all 22 indicators used point to short positions.
Indicators and moving averages
- Daily RSI (14) is around 36–37, slightly above oversold; on the 4-hour chart RSI is near 25, indicating deep oversold conditions.
- Daily EMA50 - $4,330; price trades well below it.
- EMA144 - $4,356.
- EMA200 - $4,318, a key medium-term resistance.
- OsMA shows a negative histogram confirming seller dominance.
- Stochastic is in oversold territory, which may presage a technical bounce.
Key levels
- Resistance: 4,200.00 (nearest barrier), 4,260.00 (W1 EMA50), 4,300.00 (round), 4,302.00 (H1 EMA200), 4,318.00 (D1 EMA200), 4,330.00 (D1 EMA50), 4,340.00 (H4 EMA200), 4,356.00 (D1 EMA144).
- Support: 4,150.00 (Aug 5 low), 4,140.00 (today's low), 4,100.00 (round), 4,000.00 (psychological and structural low), 3,940.00 (local support).
Gold is trying to hold above 4,150, but stabilization requires a return above 4,260.00. A break below 4,100.00 would open the door to 4,000.00 and then 3,940.00.
Events to watch
Main question of the week — will gold hold above 4,000? If it does, a technical bounce toward 4,260–4,300 is possible. Economists note oversold conditions may attract dip buyers near 4,000, a more reliable structural low.
- Wednesday, September 30, 12:30 GMT — PCE (Fed's preferred inflation gauge). Consensus expects core PCE +0.2% m/m in August. A higher print would bolster October-hike odds and add pressure to gold; a lower print would give the metal short-term relief.
- Thursday, October 1, 14:00 GMT — ISM manufacturing PMI for September. Prior value 54.6. Strong data would confirm economic resilience and support Fed hawks.
- Friday, October 2, 12:30 GMT — US NFP for September. Consensus 84k vs 162k in August; a strong print would push Fed tightening bets and weigh on gold, while a weak print would support the metal.
ETF demand remains steady but not trend-breaking. ANZ notes gold ETF holdings rose by roughly 50 tons since the start of the month, providing floor support. Central bank buying continues, which limits the scope for a deep sell-off.
Conclusion and recommendations
WTI retains upward pressure despite potential short-term correction, while gold trades at an eight-week low under oil and Fed hawks. The key level for bulls is 4,260.00 and for bears 4,140.00.
For short-term traders:
- Consider shorts on a sustained break of 4,140.00 with targets 4,100.00–4,000.00 and a stop above 4,210–4,260.00.
- Longs are risky until PCE: consider longs on a firm rebound from 4,150.00 with targets 4,260.00–4,300.00.
- Watch PCE (30 Sept) and NFP (2 Oct) as principal triggers.
For medium-term investors:
- A correction toward 4,000–3,940 could be used to scale into longs if central bank and ETF demand remains constructive.
- The World Bank projects a 37% rise in gold prices in 2026, suggesting scope for recovery from current levels.
Risk management:
- Expect elevated volatility around inflation and employment releases.
- Use strict stop-loss rules, especially on breakouts of key levels.
- Monitor bond yields, oil prices and Fed commentary closely.
This review is based on public sources and media reports and represents a market sensitive analysis; maintain risk controls and position oversight.


