यह भी देखें

 30.04.2026 06:30 AM
The situation in the cryptocurrency market continues to change in our favor. Let's remind ourselves that in recent months, we have repeatedly mentioned expecting a resumption of the downward trend. This week, for the first time in two months, a sell signal was generated on the daily timeframe. In general, "digital gold" has been in an upward correction for 2.5 months, but any correction eventually comes to an end. Bitcoin has twice reacted to the nearest "bearish" FVG on the daily timeframe, and both times it has rebounded. On the hourly timeframe, confirmation has been received in the form of a broken structure with a breach of the last local low at $77,000. The upward structure has also been broken on the 4-hour timeframe (breach of the CHOCH line). Thus, traders have received multiple signals indicating a short-term trend shift to the downside. A short-term downward trend may signal the beginning of a new phase of a medium-term downward trend. Essentially, sell signals have already been formed, so traders can now look for "bearish" patterns to open trades in line with the main trend.
Yesterday marked the FOMC meeting, the last under Jerome Powell's tenure as chairman of the U.S. central bank. What conclusions might the cryptocurrency market draw from this? Jerome Powell announced that he is stepping down from his position, but will remain on the board. This means that Powell will continue to perform managing duties and participate in votes concerning the key rate. This indicates that the Federal Reserve has a "shadow head." Kevin Warsh, who is likely to lead the Fed starting May 15, will adhere to "dovish" views, which are very favorable for the cryptocurrency market and Bitcoin. However, Powell's presence on the Monetary Committee will work against the convictions of Donald Trump and Warsh. Therefore, monetary policy may remain tighter in the next year than it would have if Powell had completely left the Fed.
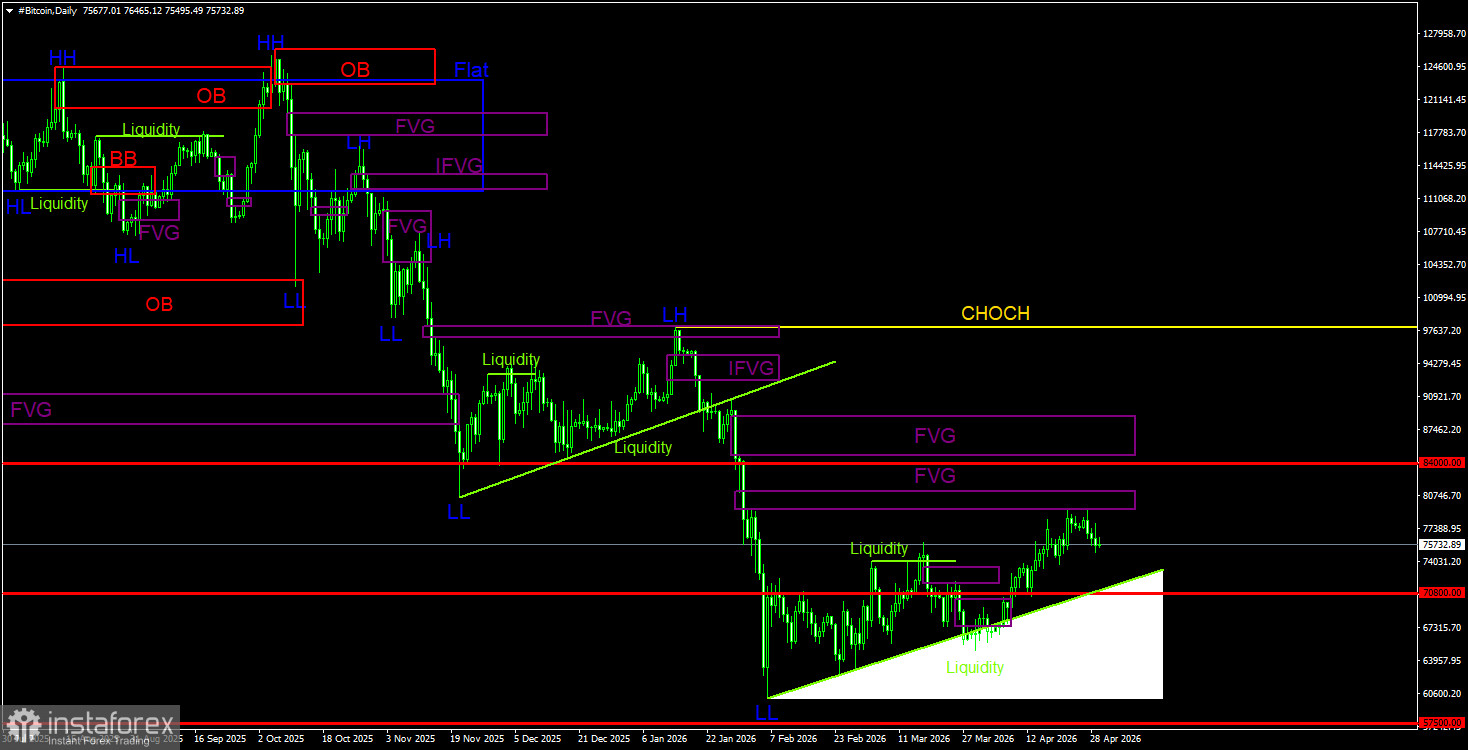
On the daily timeframe, Bitcoin continues to develop a downward trend and is in correction against it. The trend structure is identified as downward, and the CHOCH line remains at the level of $97,900. Only above this level can we consider the downward trend to be over. Given no signs of a trend reversal to the upside, we believe the decline will resume. The nearest POI range for new sell trades is $79,500–$81,100. This area has already been tested twice, and confirmation has been established on the hourly timeframe through a broken upward structure. The liquidity pool below the trend line remains a price target.
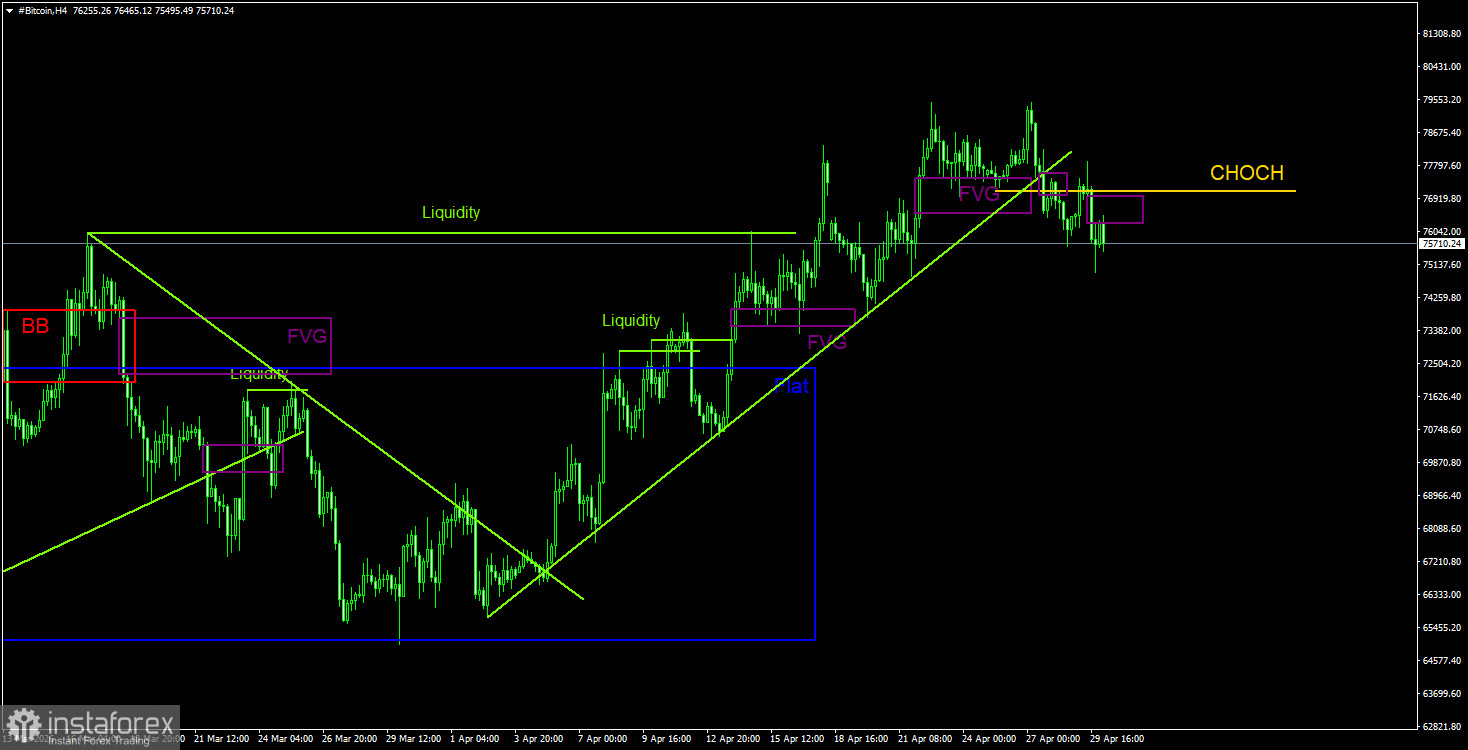
On the 4-hour timeframe, the price may be completing the formation of an upward trend, as the upward structure has been broken (breach of the CHOCH line). The overall market movement in cryptocurrency remains unattractive, though typical for a correction. Further growth is highly questionable, as the price on the daily timeframe has reacted to the bearish FVG, suggesting the correction may be nearing an end. The completion of the upward trend could serve as a starting point for a new phase of the trend on the daily timeframe. In the near term, we would look for bearish patterns and short positions.
Bitcoin continues to develop a full-fledged downward trend and correction against it. We continue to anticipate a decline targeting $57,500 (the 61.8% Fibonacci level from the three-year upward trend), and there are currently no signs of a trend reversal. However, even the $57,500 level does not appear to be a final stop. Among the POI areas, only the nearest bearish FVG on the daily timeframe should be noted, in the range of $79,300–$81,200. The price has reacted to this area, with confirmation formed on the hourly timeframe, and a structure break on the 4-hour timeframe. Therefore, in the near term, it is advisable to open short positions while monitoring the formation of bearish patterns. The targets for the decline remain below the $60,000 level.
CHOCH – break of trend structure.
Liquidity – Liquidity, Stop Loss of traders, which market-makers use to build their positions.
FVG – Area of price inefficiency. Prices pass through such areas very quickly, indicating a complete absence of one side in the market. Subsequently, the price tends to return and react to such areas.
IFVG – Inverted area of price inefficiency. After returning to such an area, the price does not react but impulsively breaks through it and then tests it from the other side.
OB – Order Block. The candle on which the market-maker opened a position, intending to capture liquidity to form their position in the opposite direction.

