
Lihat juga


 14.09.2026 10:43 AM
Oil is above $100/bbl, Treasury yields are at multi?year highs, and inflation has accelerated to 3.4%. By the conventional scenario, the stock market should have collapsed. Instead, the S&P 500 interrupted a four?session losing streak.
Stock market dynamics
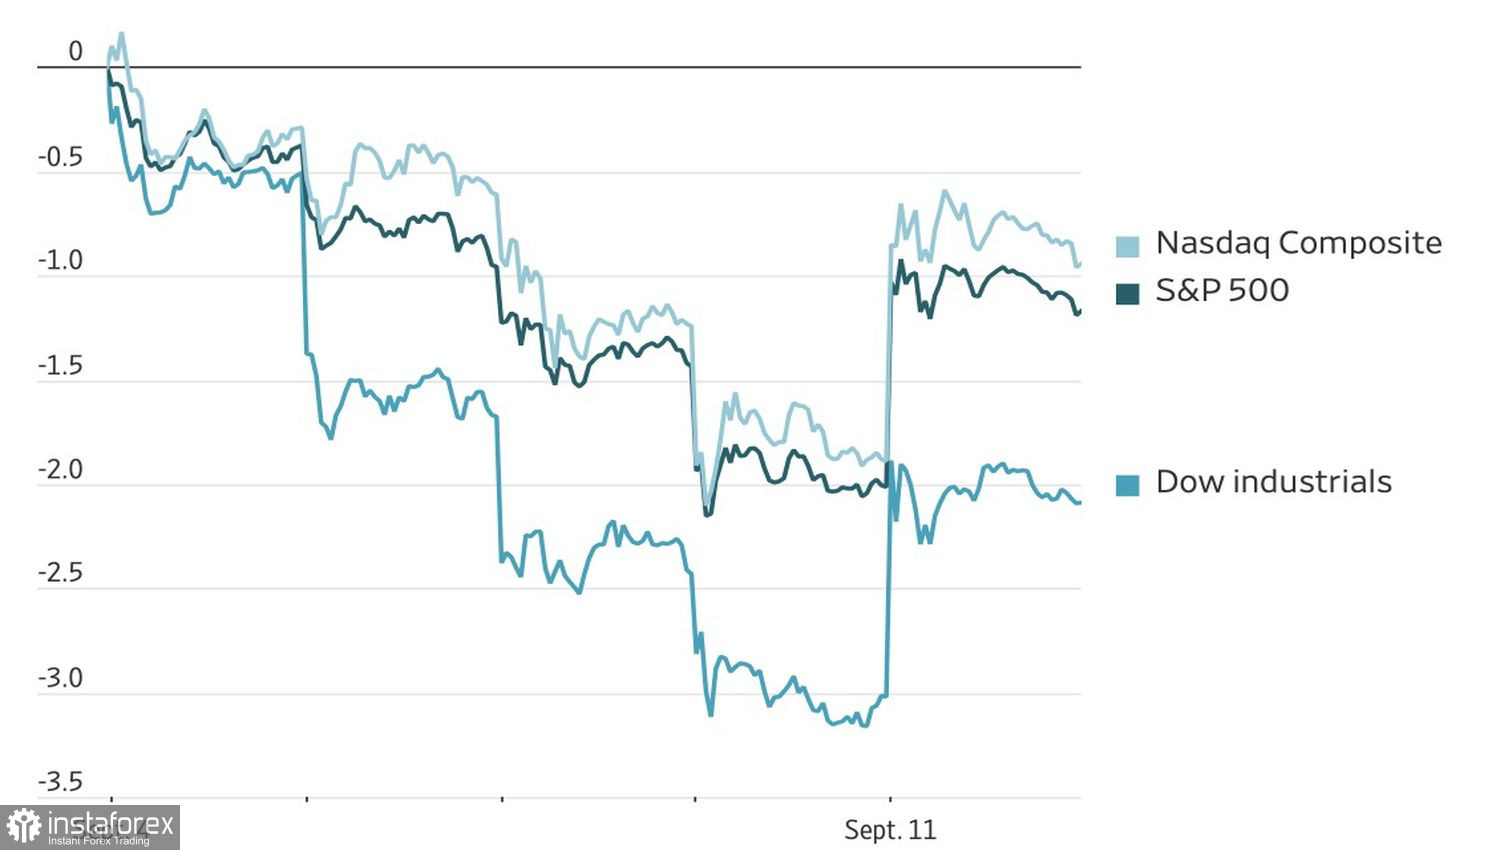
Brent's pullback more than offset hotter?than?expected inflation data for August. Sometimes all Wall Street wants is clarity, even if that clarity brings the pain of higher rates. The inflation report was hot, but not catastrophically so, and after weeks of speculation, the market finally received a degree of certainty ahead of the FOMC meeting. CME futures now price in an 87% chance of Fed tightening in September.
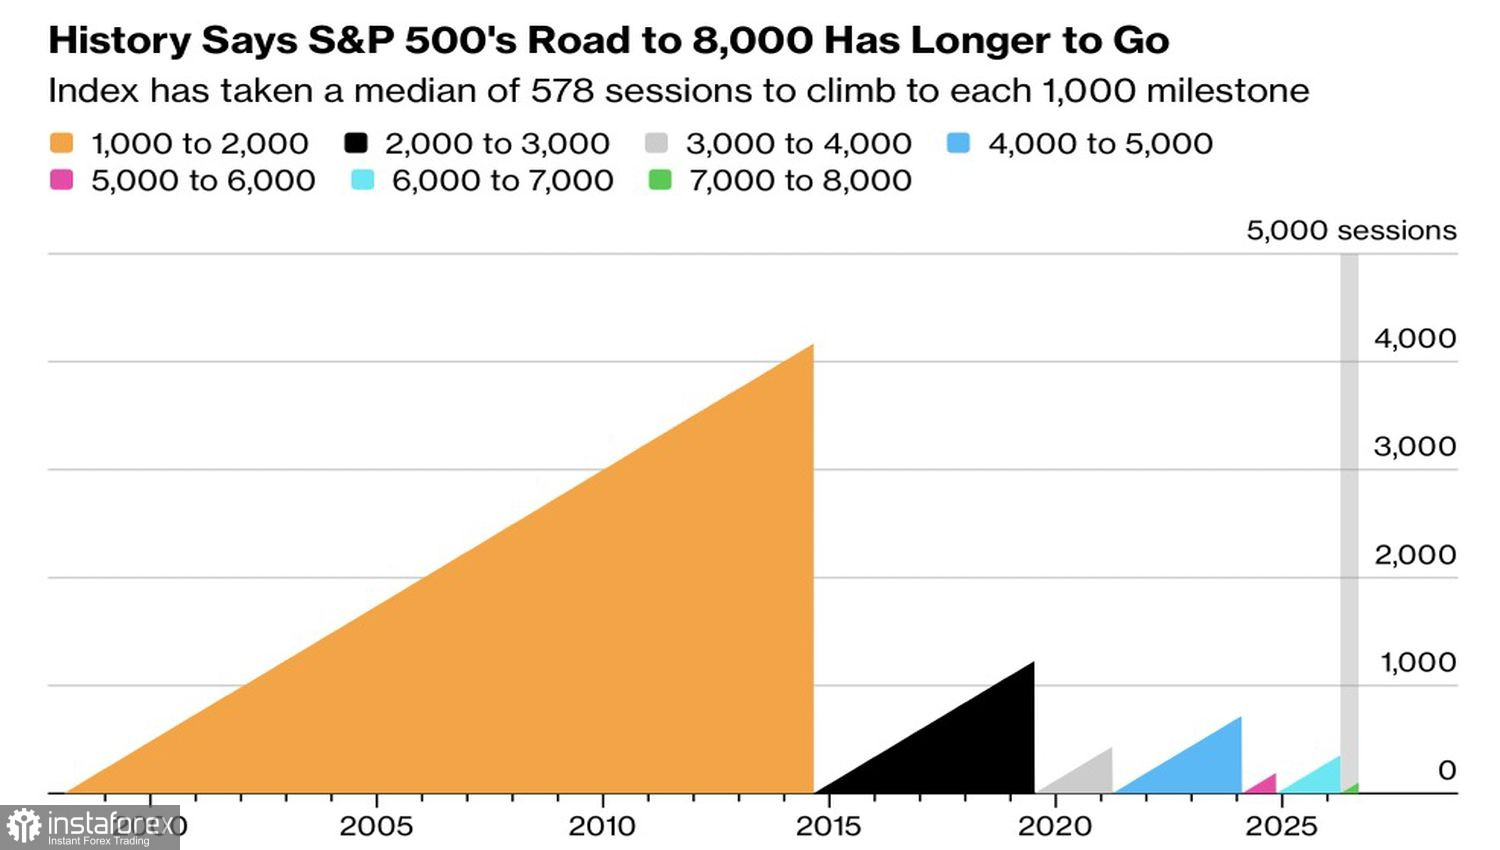
The week was nonetheless tough for stocks. The S&P 500 lost 1.8% from Monday through Thursday. The coveted 8,000 mark — which seemed almost within reach on August 13's intraday high — retreated again. The advance was held back by surging Treasury yields, sticky inflation, hawkish rate expectations and weak consumer sentiment.
How fast the S&P 500 was running toward round psychological levels
Higher Treasury yields hit stocks not only directly — by raising borrowing costs and slowing the economy — but indirectly as well, by making safe bonds relatively more attractive than risky equities. RBC Capital Markets now expects three Fed hikes by year?end. The firm warns that higher rates could overload even strong earnings growth. CFRA raised its S&P 500 target to 8,050 from 7,400 after solid quarterly results, candidly admitting: "We are in a phase of uncertainty, and no one knows what catalyst will push stocks higher — disinflation, AI breakthroughs, or relief from yield and oil risks."
That visible composure amid rising macro risks recalls the old duck metaphor: the market looks calm on the surface but is paddling like crazy under the water. Some Wall Street veterans even look back to the late 1990s, when tech stocks endured a rate?hike cycle and a yield spike before collapsing into a brutal sell?off years later.
An old Wall Street rule says bull markets end when the economy breaks down, or the Fed tightens monetary policy hard enough to break something. Neither has happened yet. But the risk of higher rates is clearly back on stage.
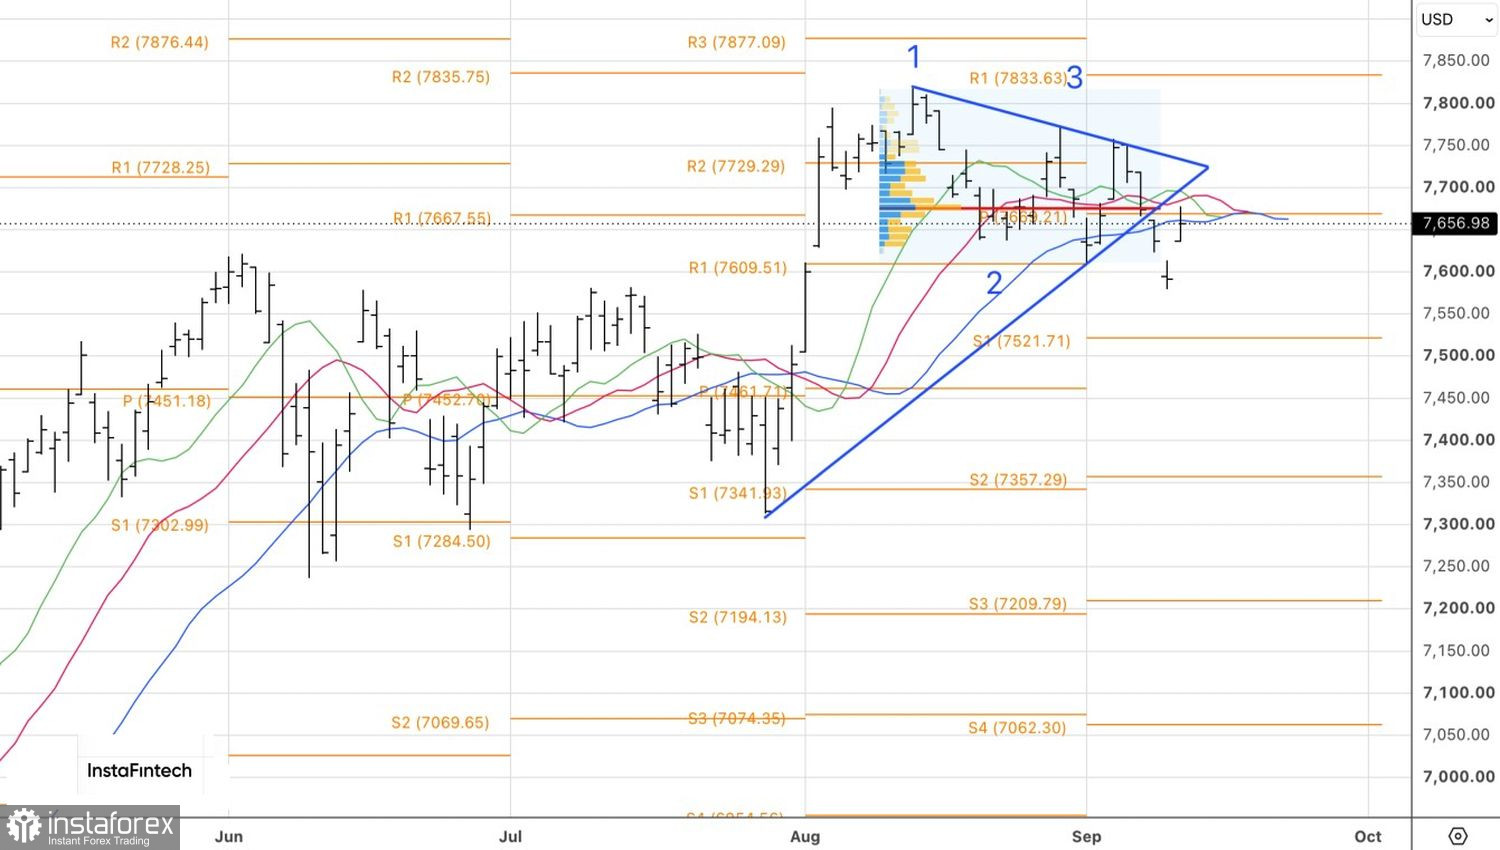
Technically, on the daily chart, the S&P 500 is returning toward a fair?value area near 7,675. A decisive break above that level, followed by a sustained move above the moving averages and into the wedge's upper boundary, would be a buy signal. Conversely, a failed test would justify sticking to a sell?on?rallies strategy.
You have already liked this post today
* Analisis pasaran yang disiarkan di sini adalah bertujuan untuk meningkatkan kesedaran anda, tetapi tidak untuk memberi arahan untuk membuat perdagangan.


