
यह भी देखें


 25.08.2026 09:59 AM
Bitcoin and Ethereum rallied rapidly and resumed gains at the start of the new week. The Treasury's decision to increase the scale of bond buybacks triggered a crypto market surge, but we have been asking for several days how long this will last given a single supporting factor. In essence, it was a "black swan" that arrived at the most unexpected moment. Despite the strong gains for both cryptocurrencies, we do not believe the downtrend is over. The fundamental backdrop for the crypto market remains weak. We still see no grounds for a sustained rally in both Bitcoin and Ethereum. The outlook for the crypto industry has become much more optimistic, but we warn traders: this may be a pump or manipulation.
Some independent experts also doubt that Bitcoin is at the start of a new bull trend. For example, they note that August and September have traditionally been "red" months for Bitcoin. The current reversal and rapid rise could be part of a broader bear trend, which is particularly visible on the weekly timeframe. Experts point out that this time the market "bottom" (if it is indeed a bottom) formed unusually quickly compared with previous cycles. They also noted that a triangle pattern formed on the monthly timeframe, and in prior cycles a break below its lower boundary led to declines of at least 50%, whereas this time the drop was only about 30%. On higher timeframes, a descending trendline can be drawn that has not yet been broken, which means the trend remains downward.
Analysts also identify two liquidity concentration zones. Pending sell orders are clustered in the $80,000–$90,000 range, while pending buy orders sit in the $48,000–$60,000 range. Both ranges act as magnets for price. A breakout of either area would amplify the move. We would also add that a sideways channel on the daily timeframe between $60,000 and $83,000 could be forming. In that case, June's lows would be a deviation of the channel's lower band, and bitcoin's fate would be decided near the upper boundary — around the CHOCH trend?break line at $83,000. A liquidity grab from that level and from the high would be considered a deviation and could trigger an equally strong fall back to $60,000 or lower.
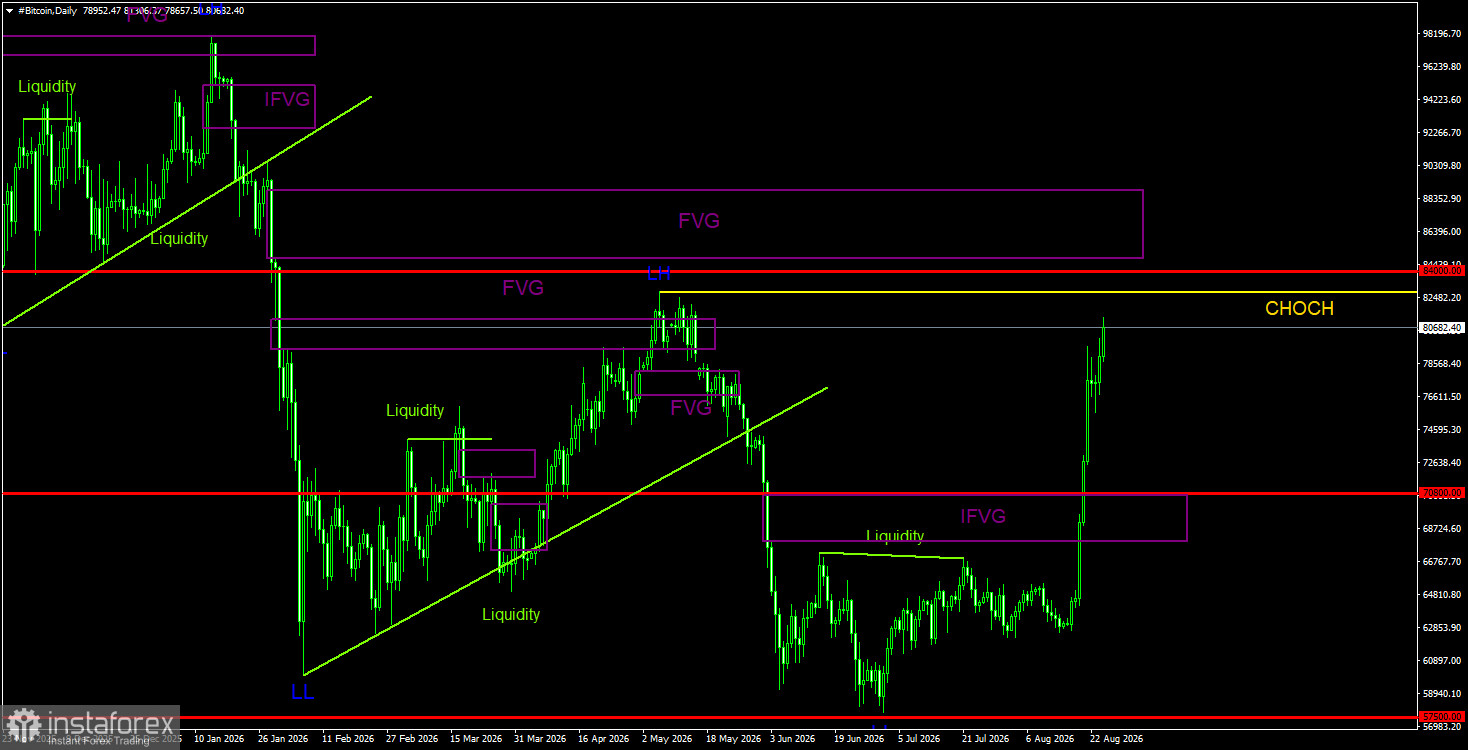
Bitcoin continues forming a downtrend despite the strong rise this week. We continue to expect a decline toward $57,500 (the 61.8% Fibonacci level of the three?year uptrend), although this level has essentially already been tested. We do not believe the downtrend is finished. The latest bearish FVG has been invalidated, and POI areas for short positions on higher charts have essentially disappeared. However, on the weekly timeframe, the current rise can still be classified as a correction. We understand the current surge in the leading cryptocurrency hardly looks like a correction, but that is not sufficient reason to open longs. The current move most resembles a pump without clear pattern formation or signals. Each trader must decide for themselves whether to open positions "in the air."
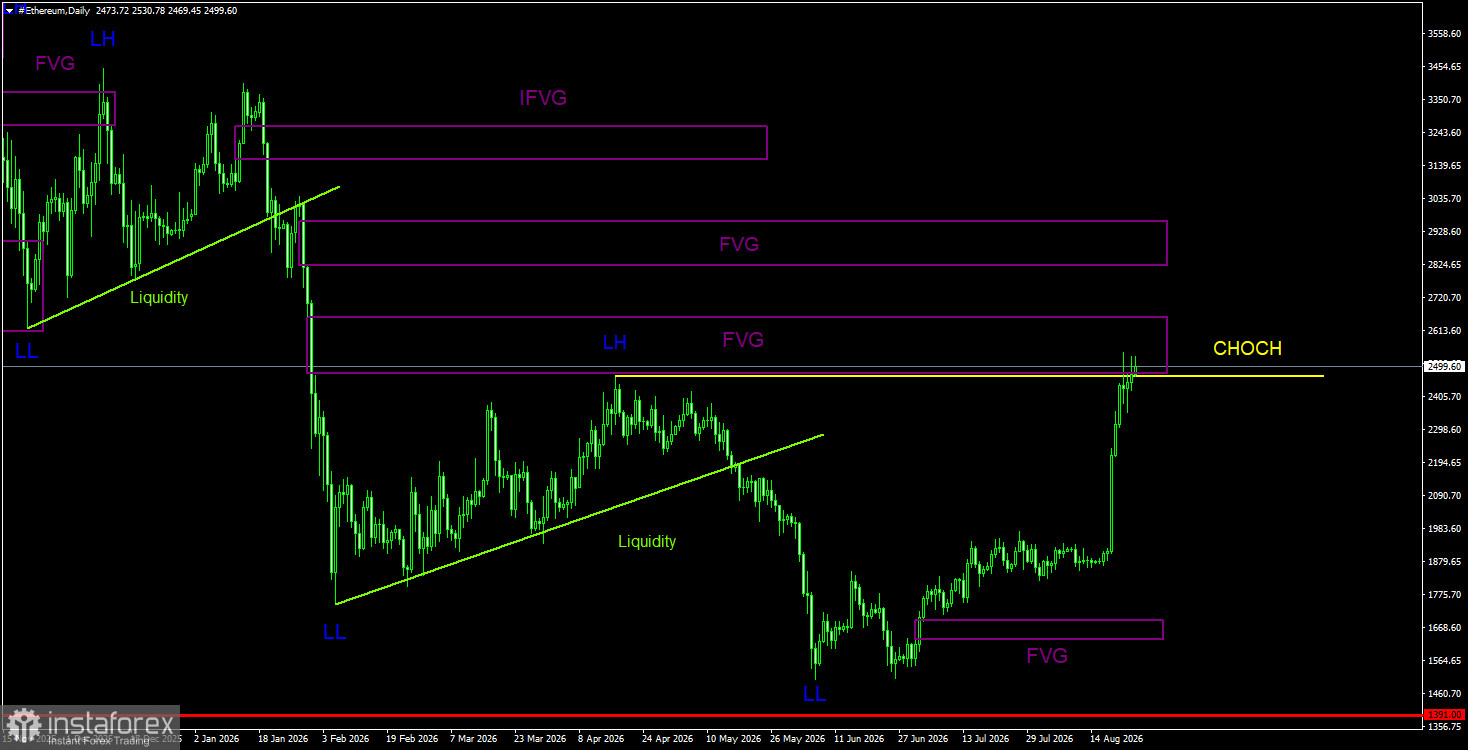
On the daily timeframe, the technical picture has completely changed in just a few days. Ether may now be starting a new uptrend, but there are no valid bullish patterns on the 4?hour or daily charts. Essentially, traders can only rely on the weekly chart, where Ethereum could head toward $4,800 — the upper band of a five?year sideways channel. In any case, to open positions, the market needs to calm down and form new, clear patterns. On the daily timeframe, the nearest bearish FVG has been worked off, but that FVG belongs to the previous trend; if it triggers a market reaction, it will most likely be corrective. Also note the possible liquidity grab from the April 17 high. Bitcoin may soon also remove liquidity from the obvious high and, with some probability, may get stuck in a sideways channel.
CHOCH is a change of character / break of the trend structure. Liquidity means traders' Stop?Losses that market?makers use to build their positions. FVG stands for a Fair Value Gap (area of price inefficiency). The price often moves quickly through such areas, indicating the absence of one side in the market. Later, the price tends to return and react to these zones. IFVG is an Inverted Fair Value Gap. After a return to such a zone, the price does not react but impulsively breaks through and then tests it from the other side.
OB means an Order Block. A candle on which a market?maker opened a position in order to harvest liquidity and then form their own position in the opposite direction.

