यह भी देखें

 15.05.2026 07:28 AM
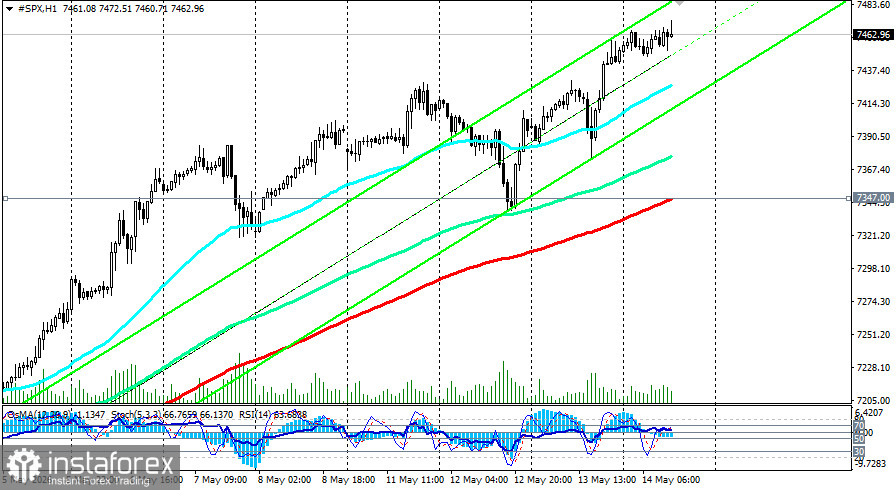
Shocking inflation data and rising expectations for a hawkish Fed (bond yields rising) create a classic bearish macro backdrop. However, the technology sector, fuelled by hopes of eased China restrictions and resilient corporate profits, continues to push the index higher, as noted in our fundamental note and the overview "S&P500 (SPX): the tech locomotive ignores the inflation shock."
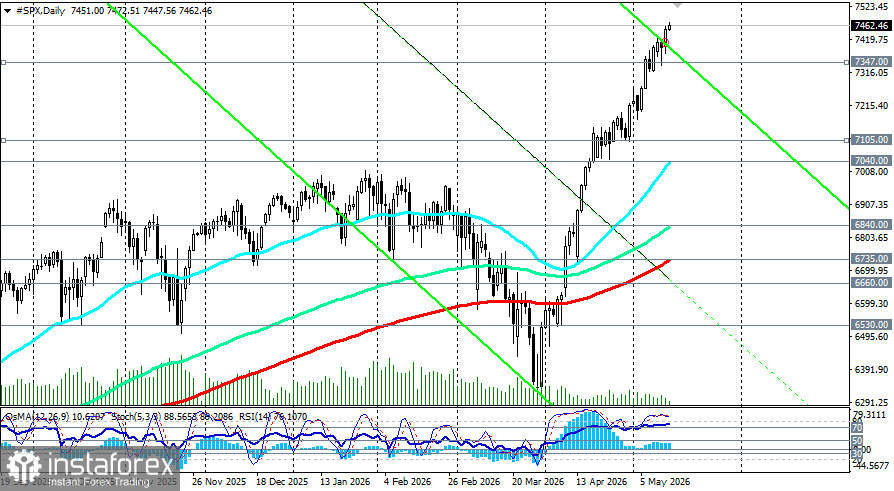
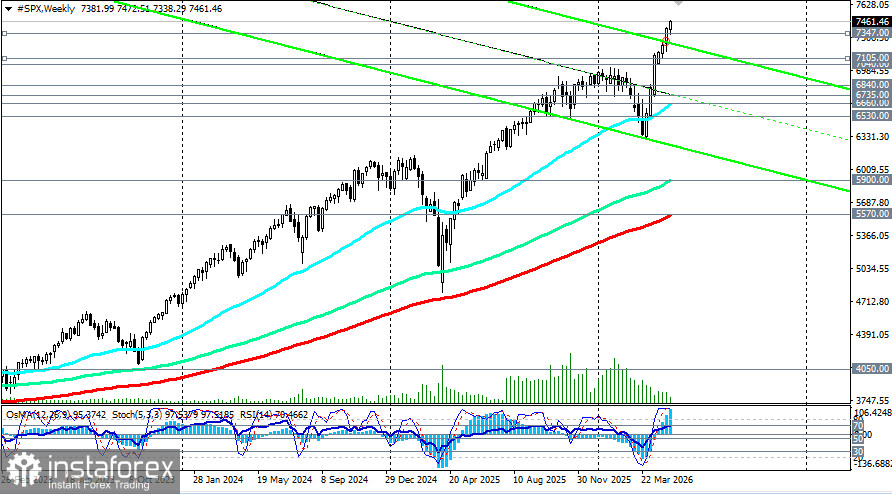
From a technical perspective, the S&P 500 remains in a sustained global bull market, showing strong bullish momentum after a powerful rebound from lows around 6,310 in late March.
On short, medium, and long timeframes, the index trades above key moving averages (50/144/200), and primary indicators remain in bullish territory.
The base bullish scenario assumes a continued uptrend after the consolidation phase. A confident break and hold above the local resistance level of 7,475 would open the way to test the psychological 7,500 level and then 7,600.
This scenario requires:
Note: On the daily chart, RSI and Stochastic indicators are in overbought territory, and OsMA, while above zero, has flattened and slightly retreated. This raises the odds of short-term consolidation or a correction after the extended advance.
A short-term correction as part of a bearish scenario is possible due to technical overbought conditions and renewed inflation concerns. A break of today's low at 7,448, followed by a breach of the round 7,400 level, would signal a move toward lower targets.
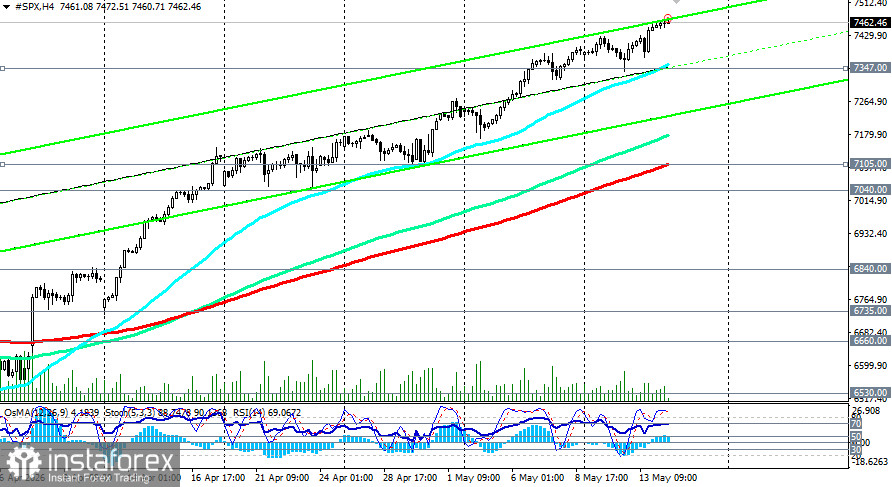
Targets: support at 7,347 (EMA200 on the 1-hour chart), then 7,200 and 7,105 (EMA200 on the 4-hour chart), and 7,040 (EMA50 on the daily chart).
The most likely scenario for the coming days is continued consolidation in the 7,400–7,500 range, with a possible dip to 7,347 (EMA200 on the 1-hour chart). The market will digest summit news and assess concrete trade and tech outcomes, which may be less significant than expected.
Traders are advised to watch the US–China summit, retail sales data, and commentary from new Fed Chair Kevin Warsh.
Support levels: 7,400.00, 7,347.00, 7,300.00, 7,200.00, 7,105.00, 7,100.00, 7,040.00, 7,000.00, 6,900.00, 6,840.00, 6,800.00, 6,735.00, 6,700.00, 6,660.00, 6,600.00, 6,530.00, 6,500.00, 64,00.00
Resistance levels: 7,475.00, 7,500.00, 7,600.00, 7,700.00, 7,800.00, 7,900.00, 8,000.00
Trading scenarios
Note: "Targets" correspond to the support/resistance levels listed above. They are reference points for planning and order placement, not guaranteed outcomes.

