यह भी देखें

 11.11.2025 10:46 AM
On Tuesday, from the level of 1.1556 (the close of yesterday's daily candle), the market may begin to move upward with a target of 1.1584 – the 21-period EMA (thin black line). When testing this line, the price may possibly pull back downward to test the retracement level of 14.6% – 1.1534 (thin yellow line).
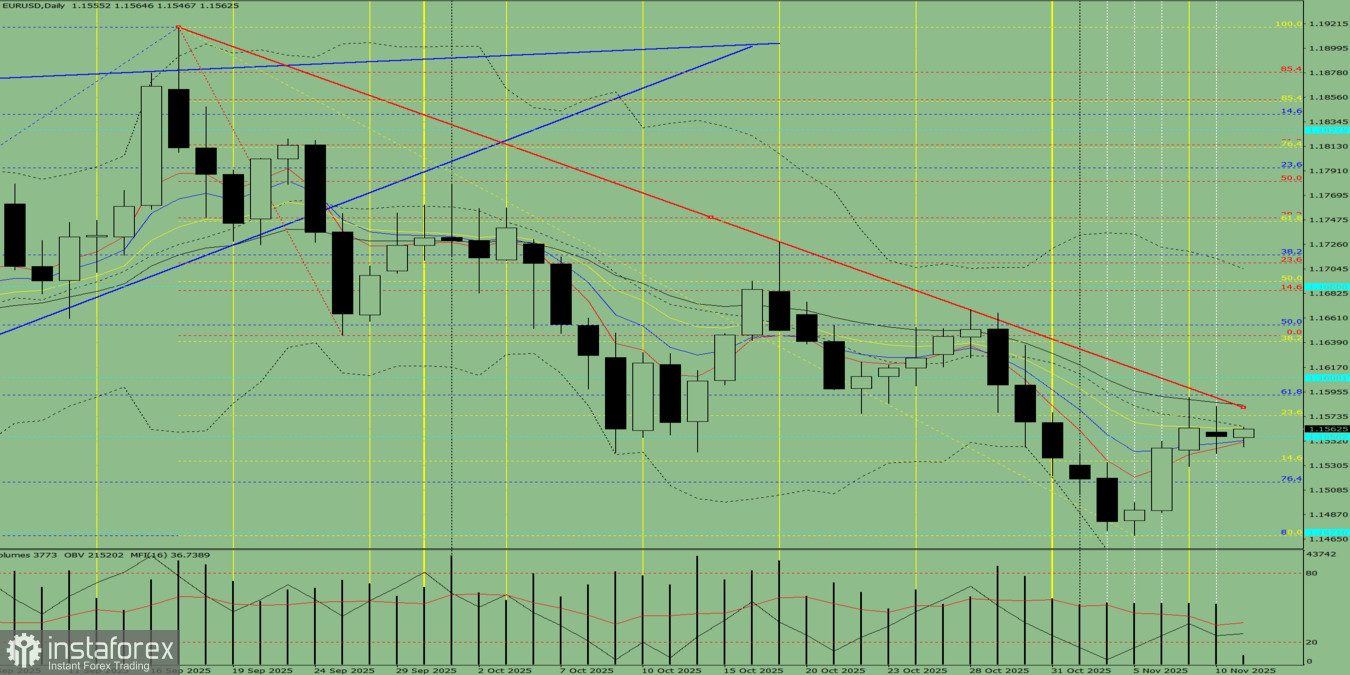
Fig. 1 (Daily Chart)
Overall conclusion: upward trend.
Alternative scenario:From the level of 1.1556 (the close of yesterday's daily candle), the price may begin to move upward with a target of 1.1593 – the 61.8% retracement level (blue dashed line). Upon testing this level, the price may possibly pull back downward toward 1.1534 – the 14.6% retracement level (yellow dashed line).
You have already liked this post today
*यहां पर लिखा गया बाजार विश्लेषण आपकी जागरूकता बढ़ाने के लिए किया है, लेकिन व्यापार करने के लिए निर्देश देने के लिए नहीं |

