See also

 30.04.2026 04:10 AM
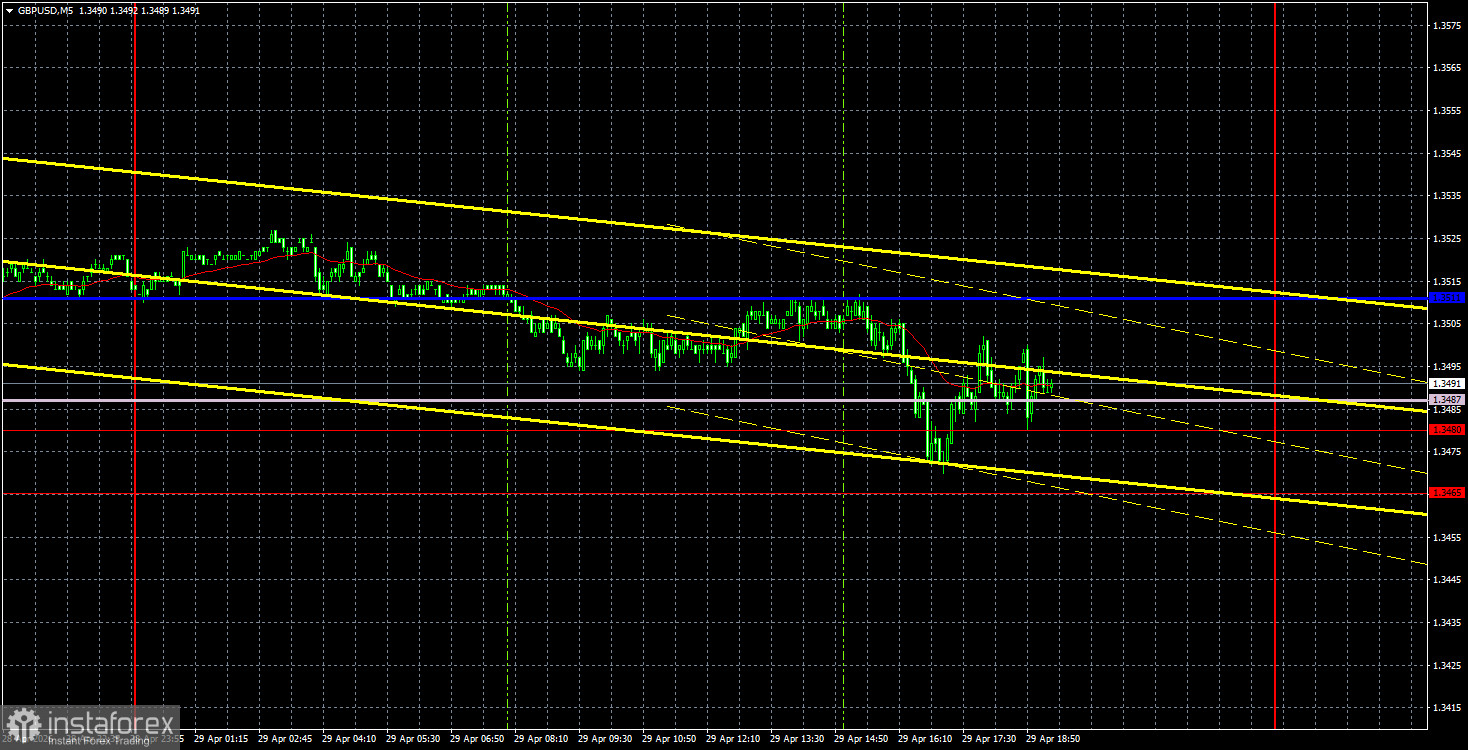
The GBP/USD currency pair once again attempted to surpass the support area of 1.3465-1.3480 on Wednesday, but failed once again. Therefore, the sideways channel of 1.3465-1.3588 remains relevant. We would only consider a downward trend below the 1.3465-1.3480 area. Volatility was again minimal on Wednesday, ahead of the late evening FOMC meeting. We are not currently considering the meeting's results or the market's reaction to them. However, it is worth noting that traders once again ignored the relatively important durable goods orders report in the U.S.
On the hourly timeframe, as we mentioned, the upward trend remains intact. There is no trend line at present, but there is no need for one right now. The first half of the week has been entirely devoid of fundamental and macroeconomic events, and only the FOMC meeting last night stirred the market slightly. Today, the Bank of England will take over this baton, so volatility throughout the day may be heightened. However, by the end of Thursday, the GBP/USD pair may still remain above the solid support area of 1.3465-1.3480.
On the 5-minute timeframe, several trading signals formed on Wednesday, but there was no reason to execute them. Initially, the pair consolidated below the critical line, then rebounded from the area of 1.3465-1.3480. The first signal was not worth paying attention to, as a powerful support area lay just below. The second signal could have been executed by traders, but we did not see any movement upwards again. It should be noted that in a flat, the lines of the Ichimoku indicator lose strength, so the boundaries of the sideways channel serve as the main points of reference.
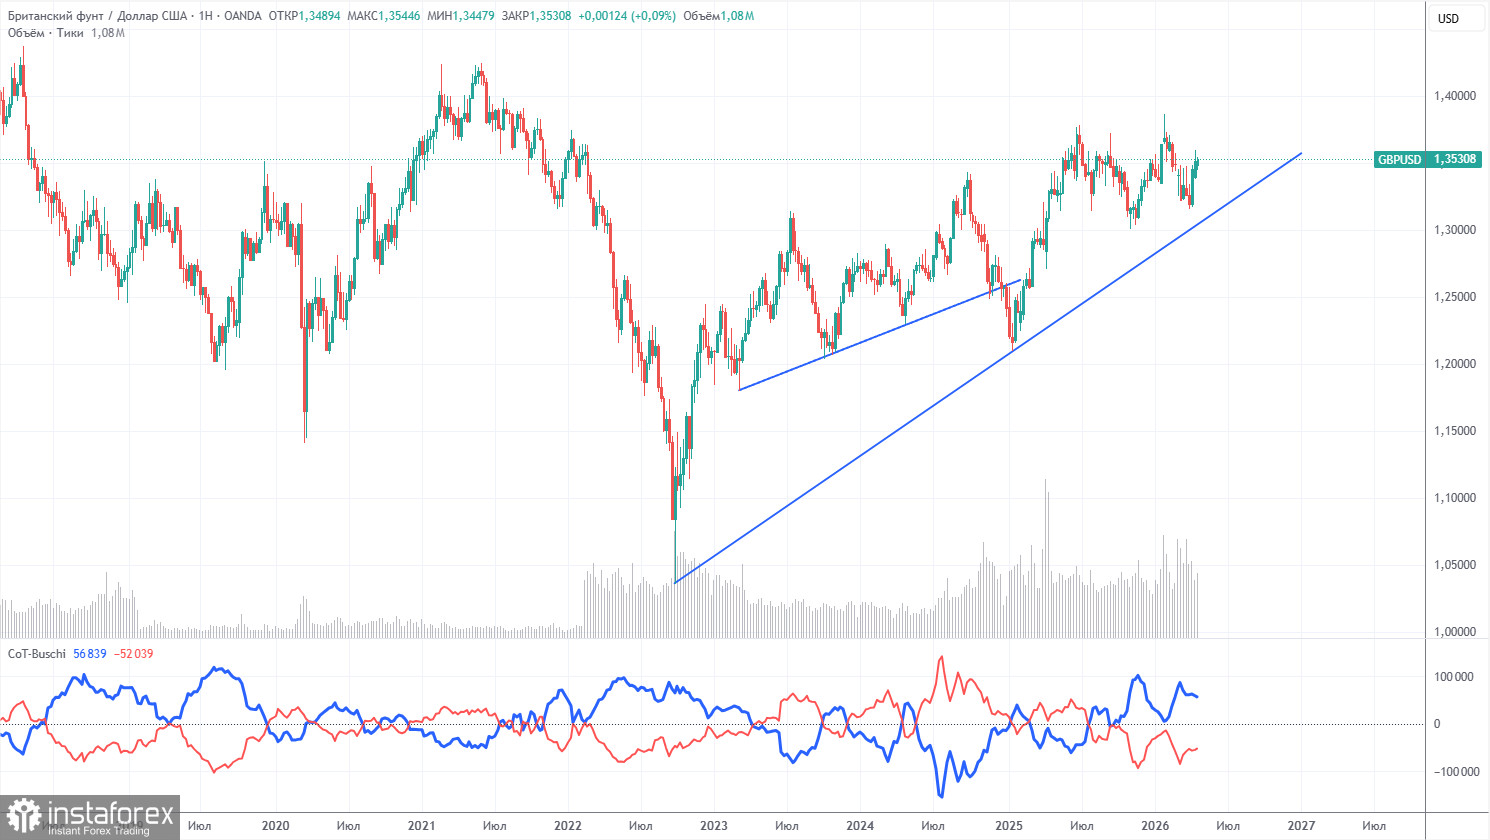
The COT reports for the British pound show that commercial traders' sentiment has been changing steadily over the past few years. The red and blue lines, which reflect the net positions of commercial and non-commercial traders, frequently cross and are often near the zero mark. Currently, the lines are moving apart, with non-commercial traders predominating with... sales. However, given events in the Middle East, it is not surprising that demand for risk currencies is falling while demand for the dollar is rising.
In the long term, the dollar continues to decline due to Donald Trump's policies, as seen on the weekly timeframe (illustration above). The trade war will continue in one form or another for a long time, and Trump's policies are aimed directly and indirectly at weakening the U.S. currency. However, geopolitical factors are currently the priority and have recently provided strong support for the dollar. Given the ongoing conflict in the Middle East, the U.S. dollar may still have growth potential. According to the latest COT report (dated April 21), the "Non-commercial" group opened 8,100 BUY contracts and 5,500 SELL contracts. Consequently, the net position of non-commercial traders increased by 2,600 contracts over the week.
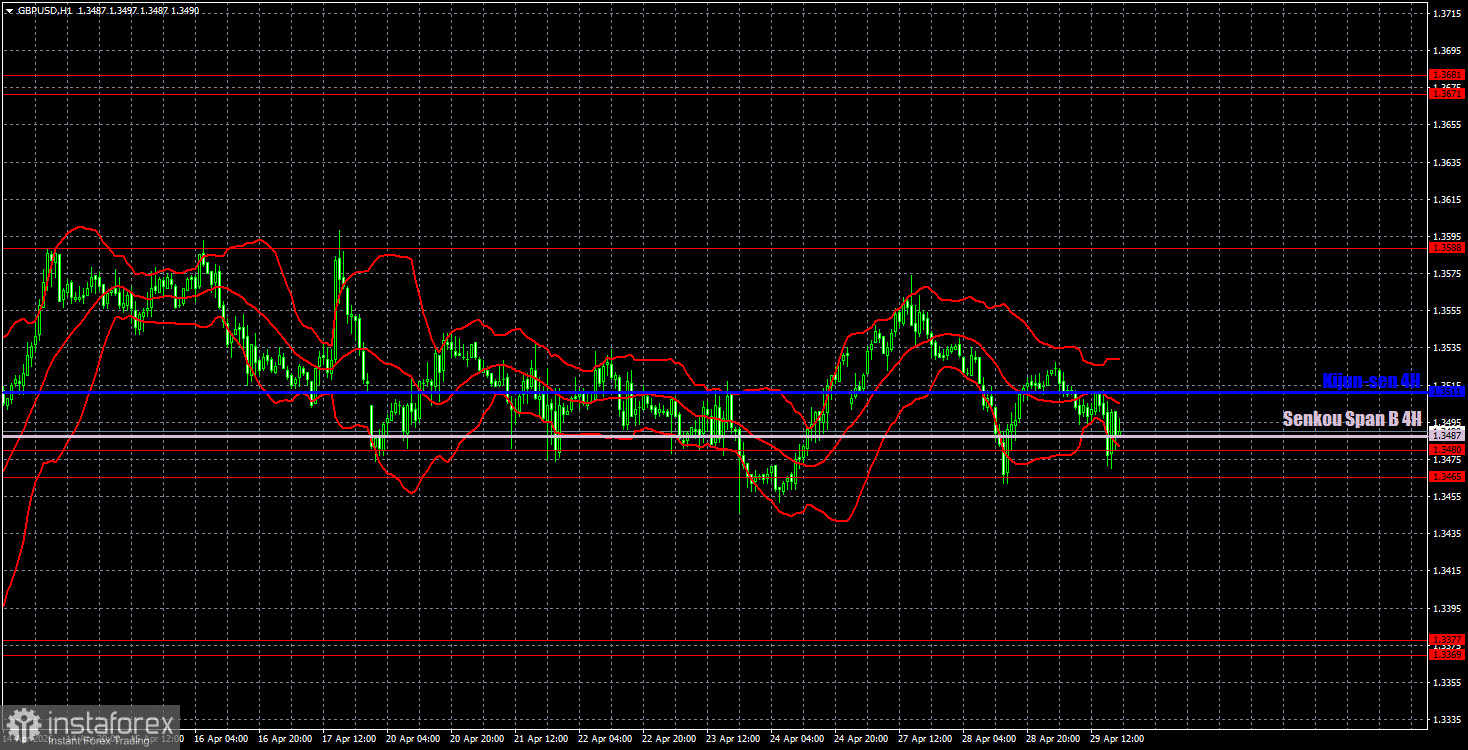
On the hourly timeframe, the GBP/USD pair continues to form an upward trend, which could be reversed if the British pound consolidates below the 1.3465-1.3480 area. The influence of geopolitical factors is weakening, as indicated by recent movements; however, military actions in the region are currently on hold. The Strait of Hormuz remains blocked, and there has been no progress in negotiations, yet there are indications that discussions are still occurring at a distance. This situation supports an upward bias in the British pound.
For April 30, we highlight the following important levels: 1.3096-1.3115, 1.3179-1.3187, 1.3369-1.3377, 1.3465-1.3480, 1.3588, 1.3671-1.3681, 1.3751-1.3763. The Senkou Span B line (1.3487) and Kijun-sen line (1.3511) may also provide signals. It is recommended to set a stop-loss order to break even if the price moves in the correct direction by 20 pips. The Ichimoku indicator lines may shift throughout the day, which should be taken into account when determining trading signals.
On Thursday, the Bank of England meeting is scheduled, and the U.S. will release its first-quarter GDP report in an initial estimate. Additionally, the market may continue to factor in the FOMC meeting results and Jerome Powell's speech. Thus, today, heightened volatility can be expected, but the pound's key task right now is to break out of the sideways channel.
Today, traders may consider short positions targeting 1.3369-1.3377 if the price consolidates below the 1.3465-1.3480 range. Long positions remain relevant, with a target of 1.3588, as the price has bounced from the 1.3465-1.3480 area.
Price levels of support and resistance – thick red lines, around which the movement may end. They are not sources of trading signals.
Kijun-sen and Senkou Span B lines – lines of the Ichimoku indicator that are carried over to the hourly timeframe from the 4-hour one. They are strong lines.
Extreme levels – thin red lines from which the price has previously bounced. They are sources of trading signals.
Yellow lines – trend lines, trend channels, and any other technical patterns.
Indicator 1 on COT charts – the size of the net position of each category of traders.


