See also

 27.03.2026 04:05 AM
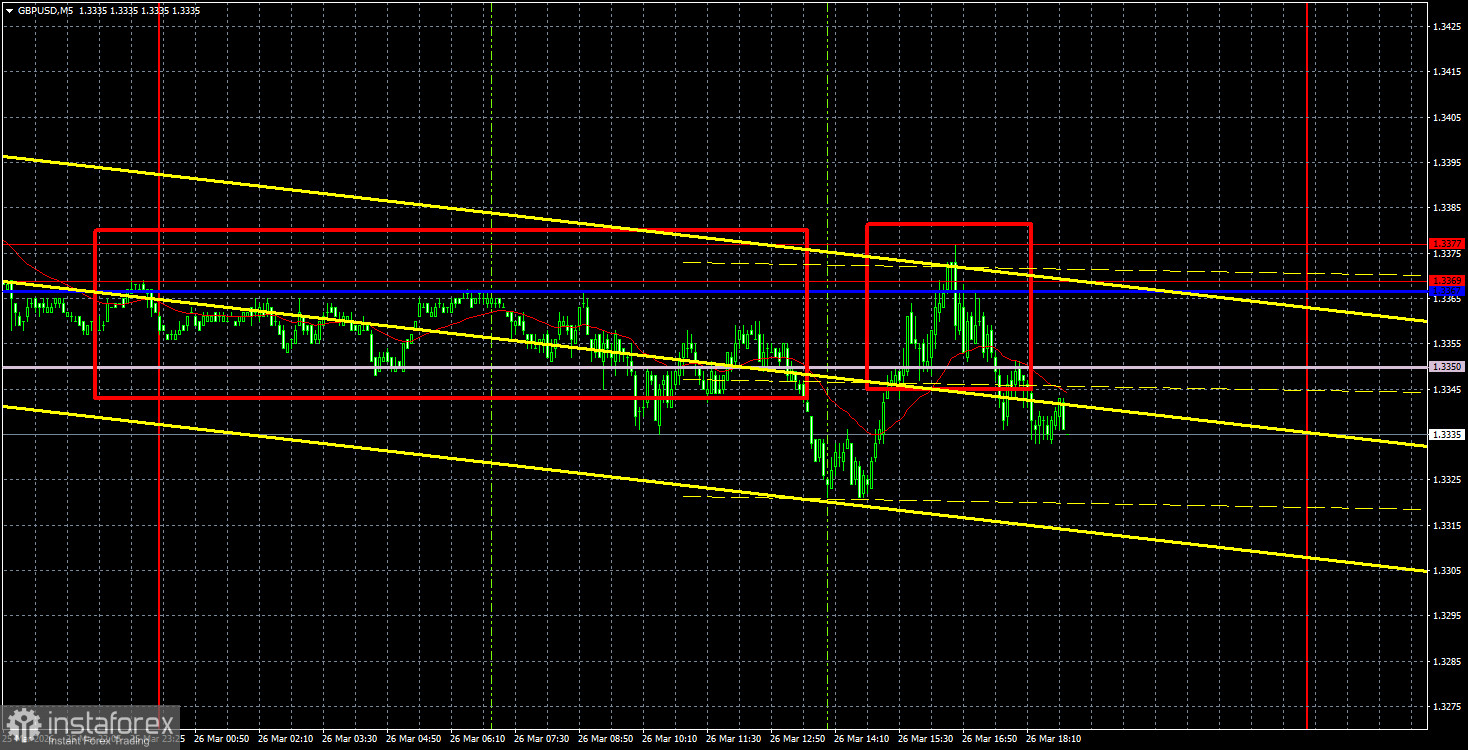
The GBP/USD currency pair continued its sluggish downward movement towards the trend line on Thursday. The upward trend has once again failed, as the British pound has not shown any significant growth over the past two weeks. Neither the Bank of England nor the inflation report could assist it, as monetary policy and macroeconomic indicators are currently of no importance to the market. Given that the situation in the Middle East could flare up even more as soon as tomorrow, traders are once again cautiously buying the dollar. The buying is quite weak for now because there is no certainty about a new escalation. However, it seems that a new escalation is on the horizon. There are no official negotiations between the US and Iran; Tehran has categorically rejected any agreements with Washington, and Donald Trump continues to entertain his audience with contradictory statements daily. Thus, the current geopolitical backdrop clearly does not support the growth of the British currency or other risk currencies.
From a technical standpoint, the upward trend persists, but it is merely in name, not in action. The price may break through the Ichimoku indicator lines and the trend line today. Therefore, the probability of further dollar growth remains higher than any chance of growth for the British pound.
On the 5-minute timeframe, two sell signals formed yesterday, but there was no point in trading them given the minimal volatility. The price bounced off the cluster of lines and levels at 1.3350-1.3377 twice but only moved down about 15 pips at its maximum, which was not enough to set a Stop Loss at breakeven.
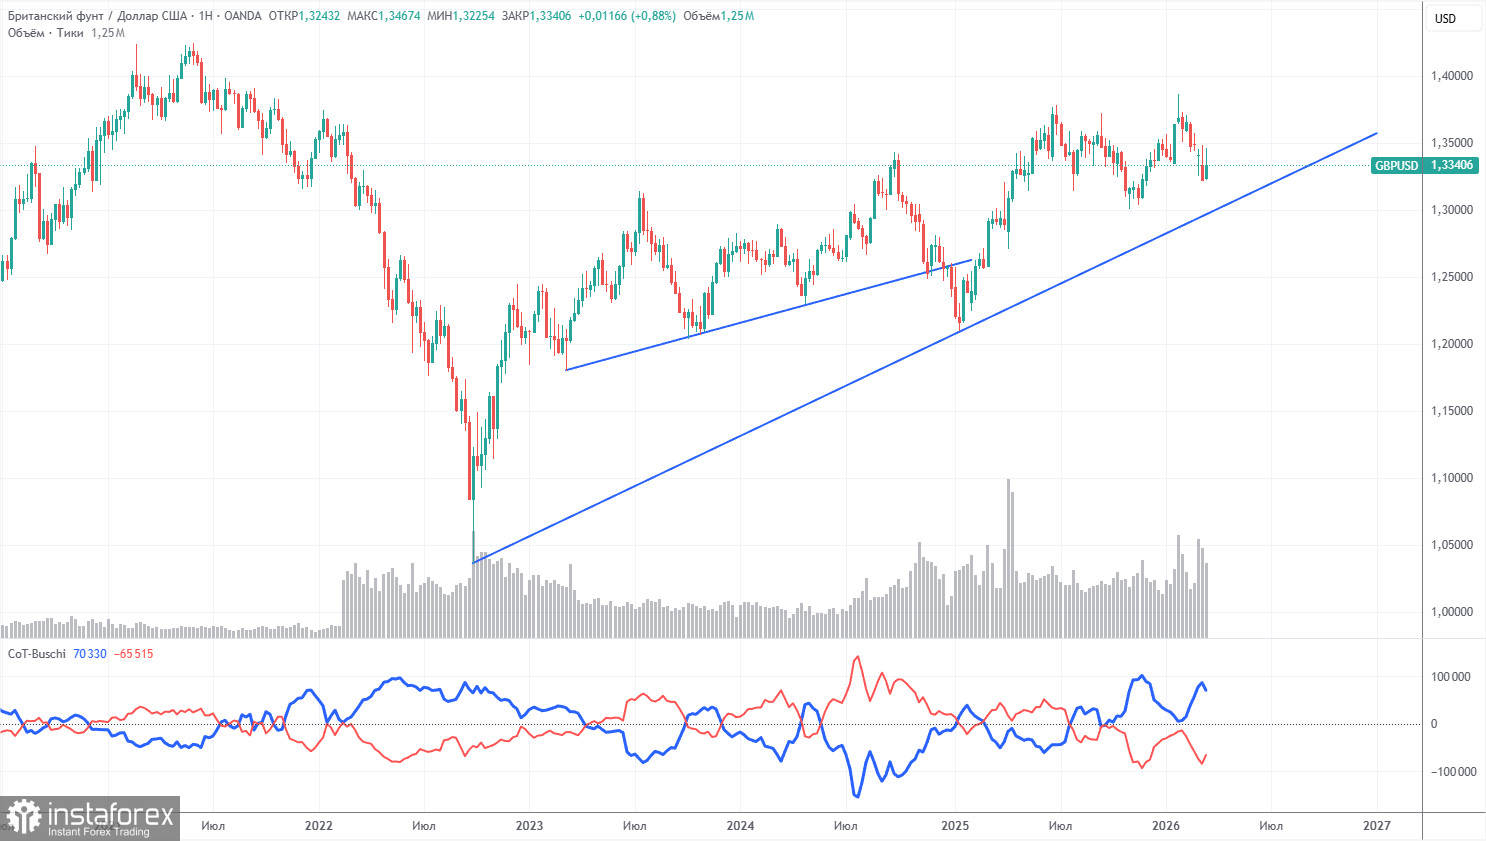
The latest COT report is dated March 17. Reports on the British pound indicate that commercial traders' sentiment has been changing frequently in recent years. The red and blue lines, representing the net positions of commercial and non-commercial traders, continuously intersect and are mostly near the zero mark. Currently, the lines are diverging, with non-commercial traders dominating with... sales. Considering the events in the Middle East, it is no surprise that demand for risk currencies is falling, while demand for the dollar is rising.
In the long term, the dollar continues to decline due to Trump's policies, as shown on the weekly timeframe. The trade war will continue in one form or another for a long time, and the Fed will, in any case, resume easing monetary policy. Demand for the dollar will decrease in the future regardless. However, geopolitical factors are currently at the forefront, providing strong support for the US currency. According to the latest COT report (dated March 17), the "Non-commercial" group closed 4,900 BUY contracts and 23,700 SELL contracts. Thus, the net position of non-commercial traders increased by 18,800 contracts over the week.
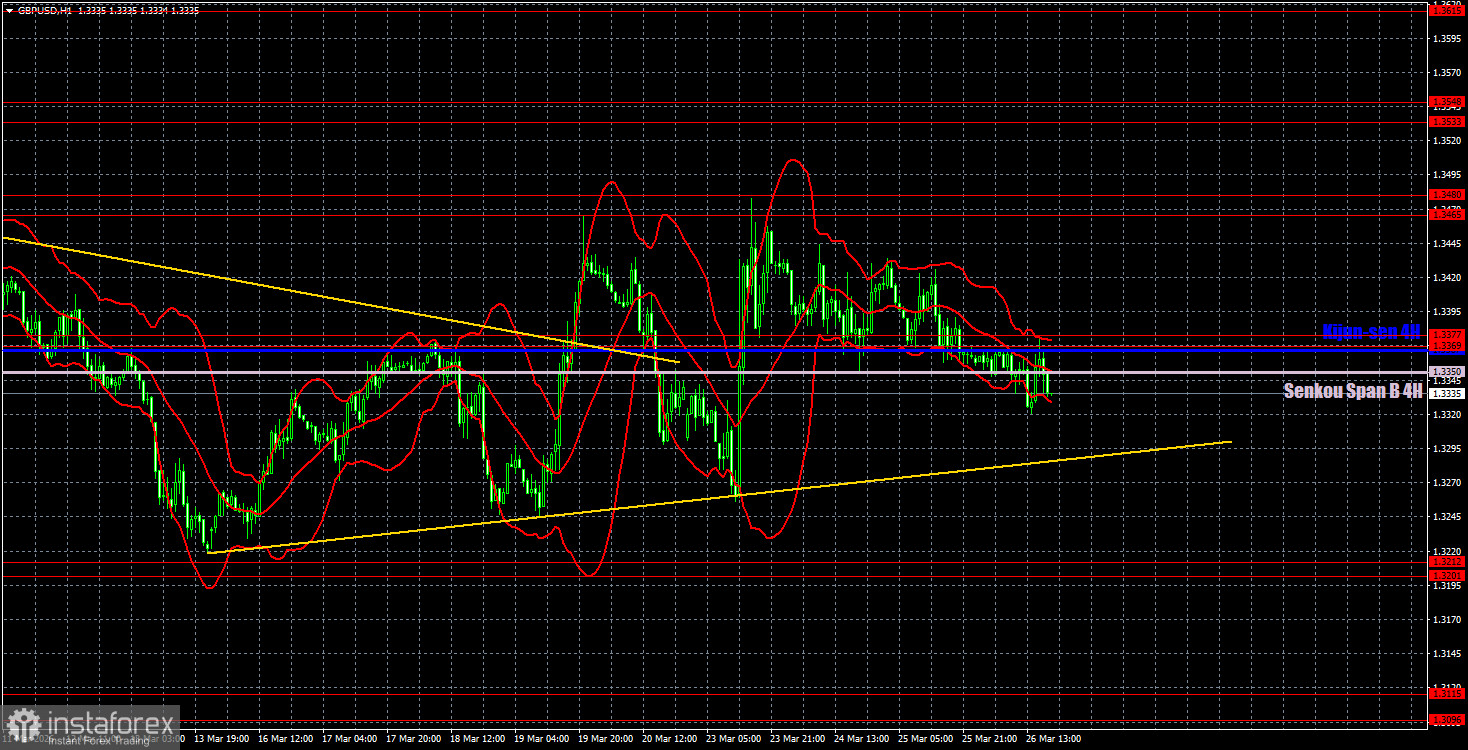
On the hourly timeframe, the GBP/USD pair continues to form a weak, uncertain upward trend that is on the verge of being canceled. New escalations in the Middle East, fresh shocks in the oil or gas markets, and the expansion of the conflict beyond the Middle East could provoke a new wave of dollar buying; therefore, the current trend is quite formal. Any increase in the European currency now is inherently unstable and depends on Trump's decisions.
For March 27, we highlight the following important trading levels: 1.3096-1.3115, 1.3201-1.3212, 1.3369-1.3377, 1.3465-1.3480, 1.3533-1.3548, 1.3615, 1.3671-1.3681, 1.3751-1.3763. The Senkou Span B line (1.3350) and Kijun-sen line (1.3368) can also be sources of signals. It is recommended to set a stop-loss order to break even when the price moves in the correct direction by 20 pips. The Ichimoku indicator lines may move during the day, which should be considered when determining trading signals.
On Friday, a retail sales report is scheduled for release in the UK, while in the US, the University of Michigan consumer sentiment index will be published. Theoretically, these reports could provoke a slight market reaction, but this reaction is unlikely to affect the overall technical picture.
Today, traders may open short positions if the price consolidates below the trend line, targeting 1.3201-1.3212. Long positions will become relevant with targets at 1.3456-1.3480 if the price consolidates above the 1.3350-1.3377 area.
Support and resistance levels are represented by thick red lines, around which the movement may end. They are not sources of trading signals.
The Kijun-sen and Senkou Span B lines are Ichimoku indicator lines that have been moved to the hourly timeframe from the 4-hour timeframe. They are strong lines.
Extreme levels are thin red lines from which the price has previously rebounded. They are sources of trading signals.
Yellow lines indicate trend lines, trend channels, and any other technical patterns.
Indicator 1 on the COT charts shows the net position size for each trader category.


