
আরও দেখুন


 28.09.2026 05:06 AM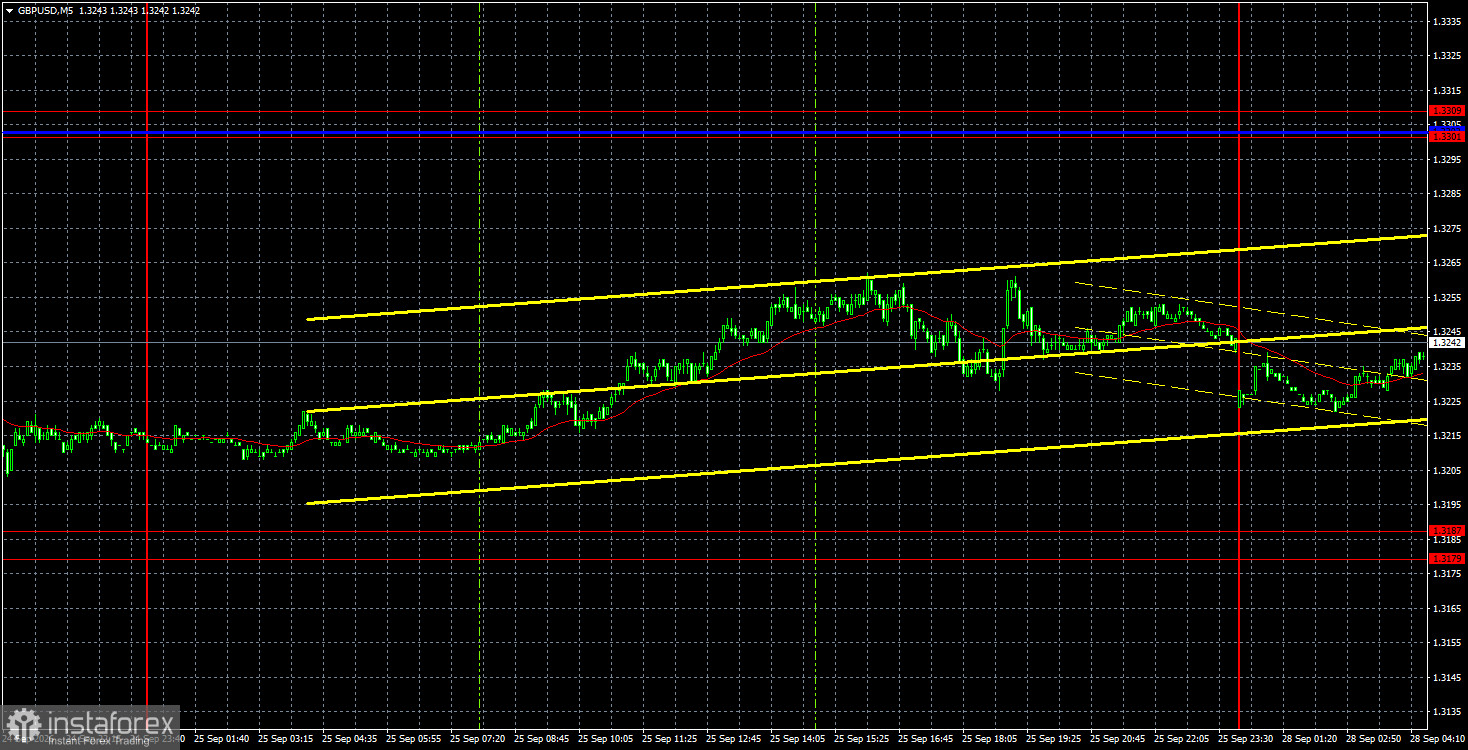
The GBP/USD pair again tried to correct on Friday, but so far it has managed only a 40-pip rise after a 350-pip fall. Thus, a correction has long been due across the FX market, but if bears do not take profits on short positions and bulls do not open long positions, there will be no upward movement. Regardless of fundamentals, macro data or geopolitics, everything depends on the market itself: either it buys or it sells. That explains the three-week dollar rally on rather dubious factors. We do not deny that in early 2026 few expected Federal Reserve tightening, but this factor alone hardly justifies the dollar gaining 350 pips in three weeks. And the move may not be over. The downward trend persists, and this week a series of important US releases could spark further dollar strength. It would be enough for PCE inflation to accelerate or for labor and business-activity data to beat forecasts for the market to conclude there is room for more Fed tightening and resume buying the dollar—even though that factor has been priced in multiple times already.
Technically, the pound continues to form a downward trend, as shown by the trend line and price trading below the Ichimoku lines. Now the pound can expect, at best, a correction within the downtrend. Despite the absence of local bearish catalysts, market participants currently show no willingness to buy the British currency.
On the 5-minute TF on Friday, no trading signals were formed. Therefore, traders had no technical reasons to enter the market.
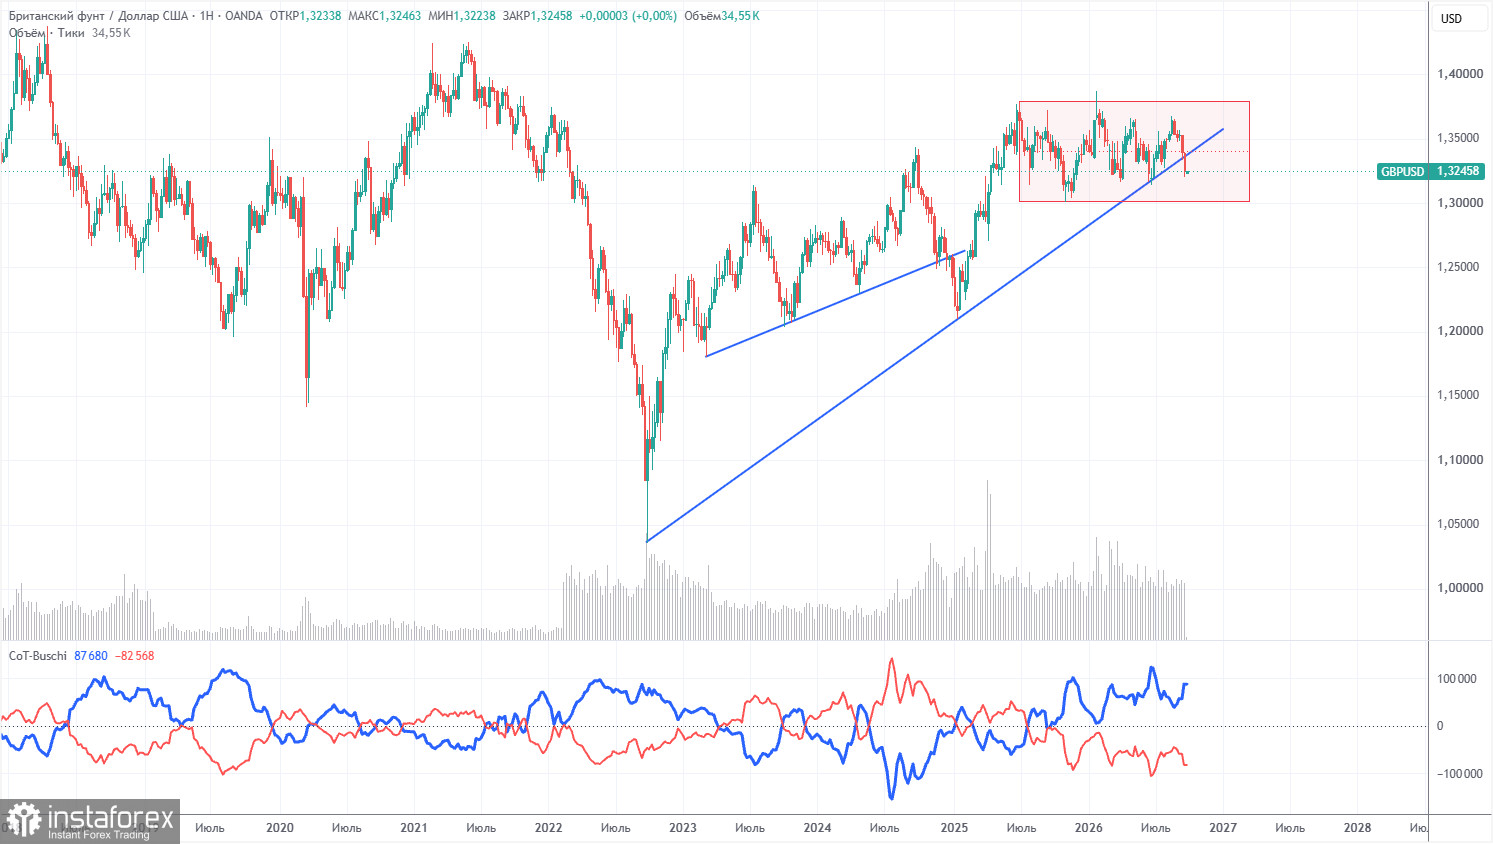
COT reports for the pound show that non-commercial traders have held net short positions for several months. The net position is negative despite the preservation of a long-term uptrend. Given events in the Middle East, it is not surprising that dollar demand was high in the first half of 2026. The war is formally over, but the conflict persists. The Fed's shifted monetary stance again supported the dollar, and the ascending trend line was breached. However, it was breached within a flat, so we do not consider the long-term uptrend to be finished.
In the long term, the dollar continues to decline due to Donald Trump's policies, which is clearly visible on the weekly TF. The trade war will continue in one form or another for a long time, and Trump's policies aim directly and indirectly to weaken the US currency. The long-term uptrend remains intact. According to the latest COT report (dated September 22), the "Non-commercial" group closed 14,900 BUY contracts and opened 8,900 SELL contracts. Thus, non-commercial traders' net position increased by 23,800 contracts over the week.
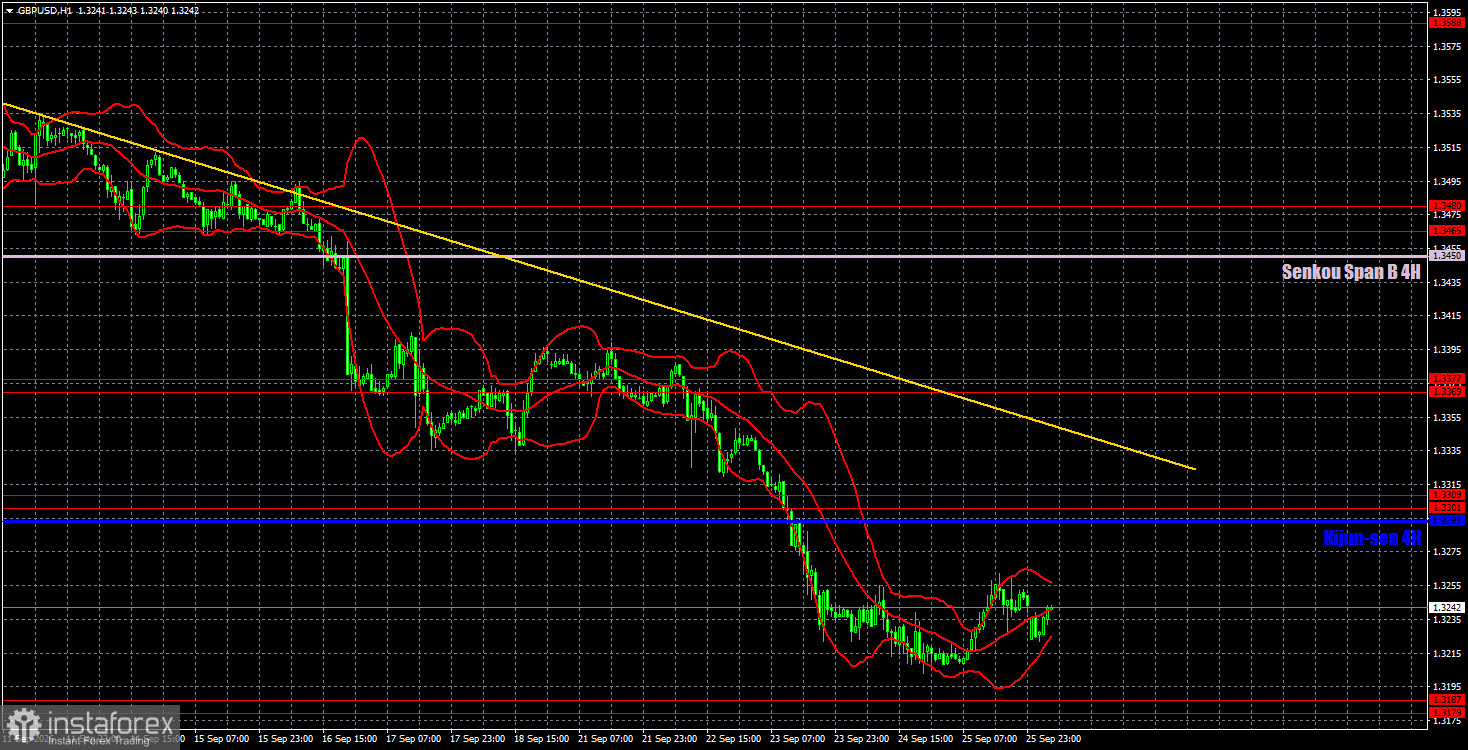
On the hourly timeframe, GBP/USD continues to form a downward trend. The Fed's decision and stance have greatly changed the US dollar's prospects and the market's attitude toward it. We would say that for the second time this year, a "black swan" arrived that brought excellent news for the dollar when no one expected it. Thus, one should now doubt the pound's upside potential.
For September 28 we highlight the following important levels: 1.3042–1.3050, 1.3096–1.3115, 1.3179–1.3187, 1.3301–1.3309, 1.3369–1.3377, 1.3465–1.3480, 1.3588, 1.3671–1.3681. The Senkou Span B line (1.3450) and the Kijun-sen (1.3293) can also be sources of signals. It is recommended to move the Stop Loss to breakeven if the price moves 20 pips in the correct direction. The Ichimoku indicator lines may shift during the day, which should be taken into account when determining trading signals.
No important publications or events are scheduled in the UK or the US today, so traders will have nothing to react to during the day. Volatility may be low today.
Traders can consider the 1.3179–1.3187 area as a target for short positions if the price rebounds from the Kijun-sen line or the 1.3301–1.3309 area. A rebound from 1.3179–1.3187 would allow you to consider a bullish target at 1.3293.
Support and resistance price levels are thick red lines where movement may conclude. They are not sources of trading signals.
The Kijun-sen and Senkou Span B lines are Ichimoku indicator lines transferred to the hourly timeframe from the 4-hour timeframe. They are strong lines.
Extreme levels are thin red lines from which the price has previously rebounded. They are sources of trading signals.
Yellow lines indicate trend lines, trending channels, and any other technical patterns.
Indicator 1 on COT charts shows the size of the net position of each category of traders.


