There are very few macroeconomic reports scheduled for Thursday, and none are particularly important. The U.S. will release a jobless claims report, and that is essentially the only economic report for today. Of course, if the actual figure deviates significantly from the forecasts, there could be a market reaction, but overall, this is a fairly secondary report, and the market has ignored even more significant reports in recent weeks, such as U.S. inflation and GDP.
Analysis of Fundamental Events:
Among the fundamental events, the speech by ECB President Christine Lagarde can be highlighted. However, what can we expect from the ECB head in the current circumstances? Recall that the ECB has indicated several times that it does not intend to either raise or lower the key interest rate in the near future. Not even the latest EU inflation report, which recorded a decline to 1.7% year-on-year, has changed the situation. However, Lagarde and several of her colleagues have already informed the market that the consumer price index may fall below the ECB's target level in a single month. For the central bank, the average long-term median is more important. If inflation consistently remains below 2%, then a new easing of monetary policy may become possible. Today, a speech by Fed representative Michelle Bowman will also take place in the U.S., but the U.S. central bank's position on monetary policy is currently as clear as day.
General Conclusions:
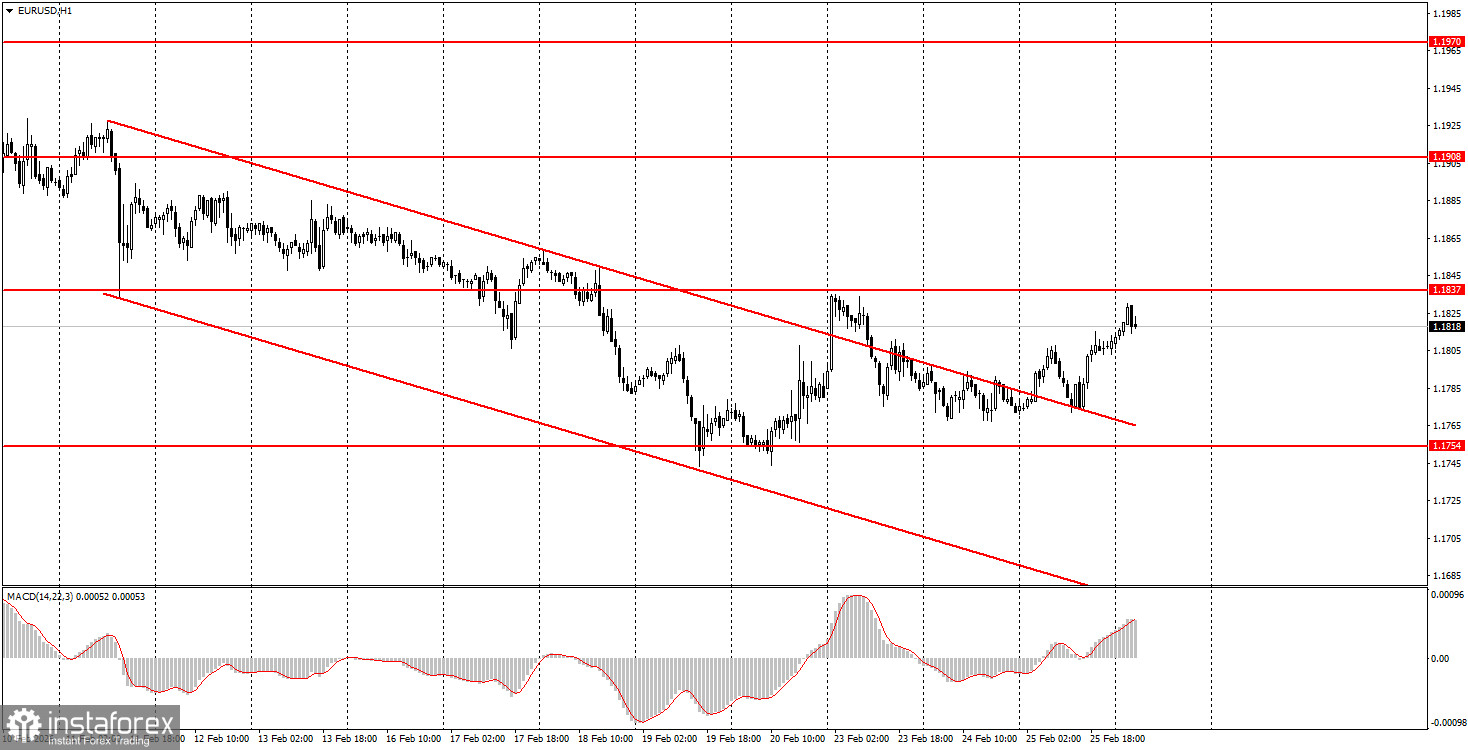
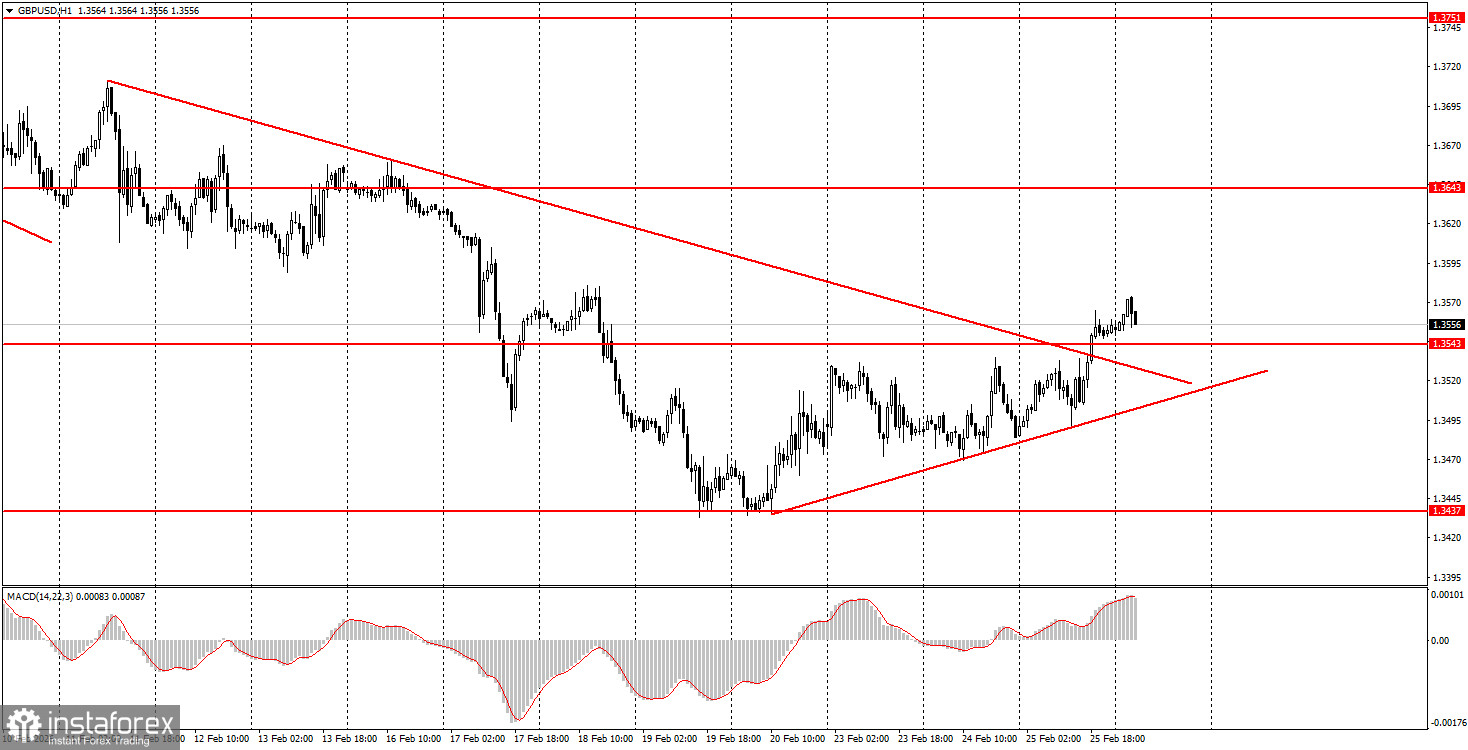
During the penultimate trading day of the week, the market may experience quite weak movements due to the lack of macroeconomic events. The euro can be traded today in the range of 1.1830-1.1837, while the British pound can be traded in the range of 1.3529-1.3543. We still do not see any grounds for strong, sustained growth in the U.S. currency; both pairs have formed upward trends.
Main Rules of the Trading System:
The strength of the signal is determined by the time it takes to form (rebound or breaking through the level). The shorter the time, the stronger the signal.
If two or more trades were opened around a particular level based on false signals, all subsequent signals from that level should be ignored.
In a flat market, any pair can generate numerous false signals or no signals at all. In any case, it is best to stop trading at the first signs of a flat.
Trades are opened during the time period between the start of the European session and until the middle of the American session, after which all trades should be manually closed.
On the hourly timeframe, signals from the MACD indicator should ideally be traded only when there is good volatility and a trend confirmed by a trend line or channel.
If two levels are too close to each other (ranging from 5 to 20 pips), they should be considered as a support or resistance area.
After moving 15-20 pips in the correct direction, it is advisable to set the Stop Loss to break-even.
What's on the Charts:
Support and resistance levels are targets for opening buy or sell trades. Take Profit levels can be placed around them.
Red lines indicate channels or trend lines that reflect the current trend and indicate the preferred direction for trading now.
The MACD indicator (14,22,3) – the histogram and signal line – serves as a supplementary indicator that can also be used as a source of signals.
Important speeches and reports (always found in the news calendar) can significantly influence the movement of the currency pair. Therefore, during their release, trading should be conducted with maximum caution, or it is advised to exit the market to avoid a sharp price reversal against the preceding movement.
Beginners trading in the Forex market should remember that not every trade can be profitable. Developing a clear strategy and practicing sound money management are the keys to long-term trading success.
You have already liked this post today
*এখানে পোস্ট করা মার্কেট বিশ্লেষণ আপনার সচেতনতা বৃদ্ধির জন্য প্রদান করা হয়, ট্রেড করার নির্দেশনা প্রদানের জন্য প্রদান করা হয় না।

 26.02.2026 06:49 AM